Creek vs Danish Single Mother Poverty
COMPARE
Creek
Danish
Single Mother Poverty
Single Mother Poverty Comparison
Creek
Danes
36.7%
SINGLE MOTHER POVERTY
0.0/ 100
METRIC RATING
331st/ 347
METRIC RANK
28.5%
SINGLE MOTHER POVERTY
87.1/ 100
METRIC RATING
141st/ 347
METRIC RANK
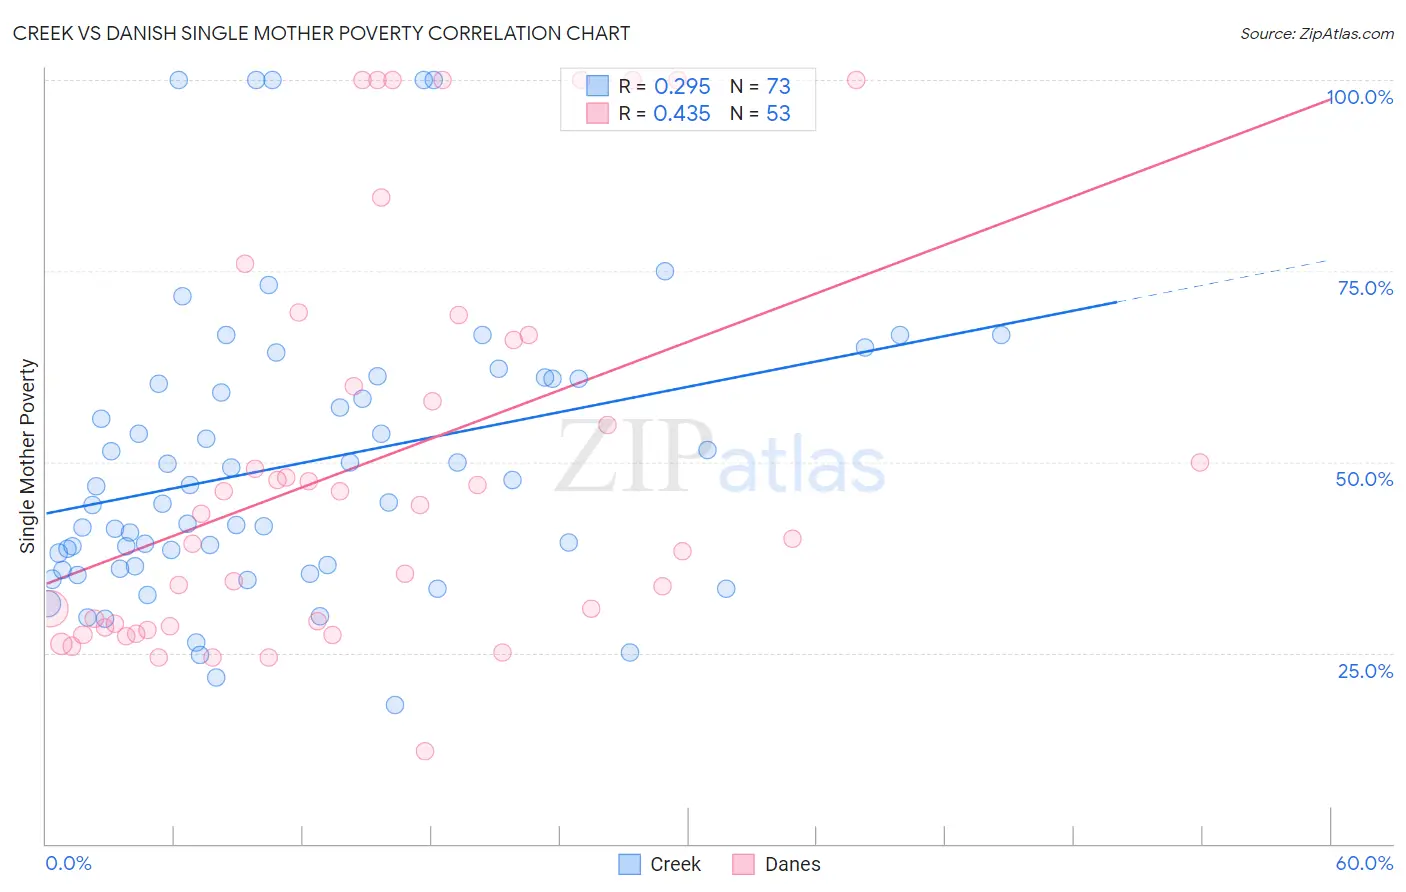
Creek vs Danish Single Mother Poverty Correlation Chart
The statistical analysis conducted on geographies consisting of 177,086,597 people shows a weak positive correlation between the proportion of Creek and poverty level among single mothers in the United States with a correlation coefficient (R) of 0.295 and weighted average of 36.7%. Similarly, the statistical analysis conducted on geographies consisting of 456,210,037 people shows a moderate positive correlation between the proportion of Danes and poverty level among single mothers in the United States with a correlation coefficient (R) of 0.435 and weighted average of 28.5%, a difference of 28.7%.
Single Mother Poverty Correlation Summary
| Measurement | Creek | Danish |
| Minimum | 18.2% | 12.1% |
| Maximum | 100.0% | 100.0% |
| Range | 81.8% | 87.9% |
| Mean | 49.7% | 49.7% |
| Median | 44.7% | 43.2% |
| Interquartile 25% (IQ1) | 36.1% | 28.4% |
| Interquartile 75% (IQ3) | 60.9% | 66.3% |
| Interquartile Range (IQR) | 24.8% | 37.9% |
| Standard Deviation (Sample) | 19.0% | 26.1% |
| Standard Deviation (Population) | 18.9% | 25.9% |
Similar Demographics by Single Mother Poverty
Demographics Similar to Creek by Single Mother Poverty
In terms of single mother poverty, the demographic groups most similar to Creek are Native/Alaskan (36.6%, a difference of 0.16%), Dutch West Indian (36.8%, a difference of 0.24%), Apache (36.6%, a difference of 0.26%), Choctaw (36.4%, a difference of 0.74%), and Yakama (36.4%, a difference of 0.79%).
| Demographics | Rating | Rank | Single Mother Poverty |
| Ottawa | 0.0 /100 | #324 | Tragic 35.5% |
| Ute | 0.0 /100 | #325 | Tragic 35.7% |
| Seminole | 0.0 /100 | #326 | Tragic 35.8% |
| Yakama | 0.0 /100 | #327 | Tragic 36.4% |
| Choctaw | 0.0 /100 | #328 | Tragic 36.4% |
| Apache | 0.0 /100 | #329 | Tragic 36.6% |
| Natives/Alaskans | 0.0 /100 | #330 | Tragic 36.6% |
| Creek | 0.0 /100 | #331 | Tragic 36.7% |
| Dutch West Indians | 0.0 /100 | #332 | Tragic 36.8% |
| Menominee | 0.0 /100 | #333 | Tragic 37.1% |
| Pueblo | 0.0 /100 | #334 | Tragic 37.2% |
| Yuman | 0.0 /100 | #335 | Tragic 37.8% |
| Cheyenne | 0.0 /100 | #336 | Tragic 38.5% |
| Immigrants | Yemen | 0.0 /100 | #337 | Tragic 38.5% |
| Pima | 0.0 /100 | #338 | Tragic 38.6% |
Demographics Similar to Danes by Single Mother Poverty
In terms of single mother poverty, the demographic groups most similar to Danes are South African (28.5%, a difference of 0.050%), Immigrants from North America (28.5%, a difference of 0.060%), Luxembourger (28.5%, a difference of 0.070%), Immigrants from Colombia (28.5%, a difference of 0.10%), and Samoan (28.5%, a difference of 0.11%).
| Demographics | Rating | Rank | Single Mother Poverty |
| Immigrants | Southern Europe | 89.2 /100 | #134 | Excellent 28.4% |
| Immigrants | Spain | 89.2 /100 | #135 | Excellent 28.4% |
| Native Hawaiians | 88.9 /100 | #136 | Excellent 28.4% |
| Immigrants | Canada | 88.9 /100 | #137 | Excellent 28.4% |
| Immigrants | Belgium | 88.5 /100 | #138 | Excellent 28.5% |
| Samoans | 88.1 /100 | #139 | Excellent 28.5% |
| Immigrants | Colombia | 88.0 /100 | #140 | Excellent 28.5% |
| Danes | 87.1 /100 | #141 | Excellent 28.5% |
| South Africans | 86.6 /100 | #142 | Excellent 28.5% |
| Immigrants | North America | 86.5 /100 | #143 | Excellent 28.5% |
| Luxembourgers | 86.4 /100 | #144 | Excellent 28.5% |
| Immigrants | South America | 86.1 /100 | #145 | Excellent 28.5% |
| Immigrants | Denmark | 86.1 /100 | #146 | Excellent 28.5% |
| Immigrants | Lebanon | 85.3 /100 | #147 | Excellent 28.6% |
| Syrians | 85.3 /100 | #148 | Excellent 28.6% |