Immigrants from Somalia vs Danish Single Mother Poverty
COMPARE
Immigrants from Somalia
Danish
Single Mother Poverty
Single Mother Poverty Comparison
Immigrants from Somalia
Danes
33.4%
SINGLE MOTHER POVERTY
0.0/ 100
METRIC RATING
301st/ 347
METRIC RANK
28.5%
SINGLE MOTHER POVERTY
87.1/ 100
METRIC RATING
141st/ 347
METRIC RANK
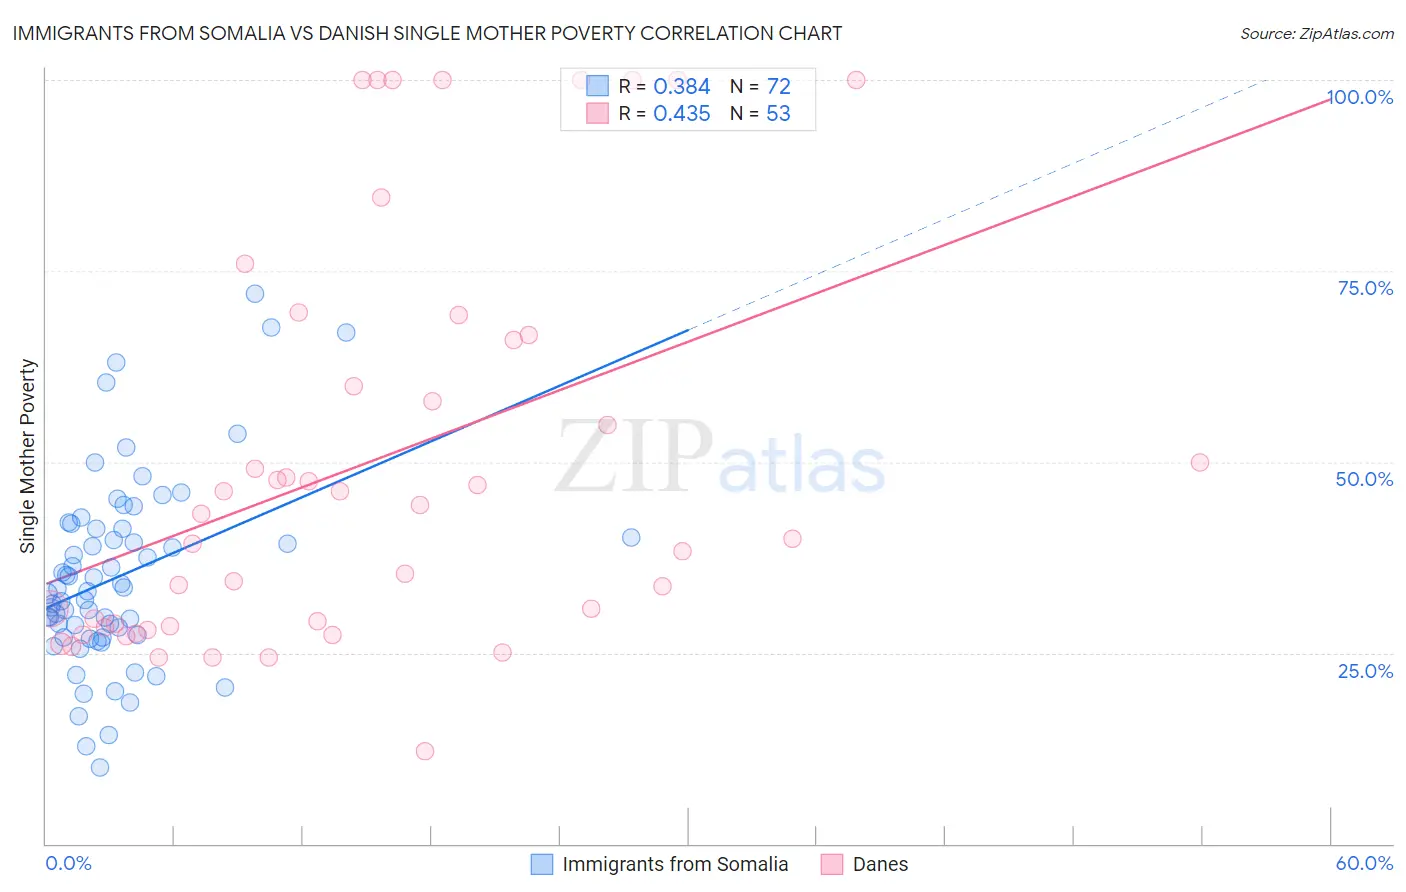
Immigrants from Somalia vs Danish Single Mother Poverty Correlation Chart
The statistical analysis conducted on geographies consisting of 91,810,835 people shows a mild positive correlation between the proportion of Immigrants from Somalia and poverty level among single mothers in the United States with a correlation coefficient (R) of 0.384 and weighted average of 33.4%. Similarly, the statistical analysis conducted on geographies consisting of 456,210,037 people shows a moderate positive correlation between the proportion of Danes and poverty level among single mothers in the United States with a correlation coefficient (R) of 0.435 and weighted average of 28.5%, a difference of 17.1%.
Single Mother Poverty Correlation Summary
| Measurement | Immigrants from Somalia | Danish |
| Minimum | 10.0% | 12.1% |
| Maximum | 72.0% | 100.0% |
| Range | 62.0% | 87.9% |
| Mean | 35.0% | 49.7% |
| Median | 33.2% | 43.2% |
| Interquartile 25% (IQ1) | 27.2% | 28.4% |
| Interquartile 75% (IQ3) | 41.2% | 66.3% |
| Interquartile Range (IQR) | 14.0% | 37.9% |
| Standard Deviation (Sample) | 12.5% | 26.1% |
| Standard Deviation (Population) | 12.4% | 25.9% |
Similar Demographics by Single Mother Poverty
Demographics Similar to Immigrants from Somalia by Single Mother Poverty
In terms of single mother poverty, the demographic groups most similar to Immigrants from Somalia are Arapaho (33.4%, a difference of 0.15%), Hispanic or Latino (33.3%, a difference of 0.24%), Immigrants from Guatemala (33.3%, a difference of 0.25%), African (33.3%, a difference of 0.33%), and American (33.5%, a difference of 0.41%).
| Demographics | Rating | Rank | Single Mother Poverty |
| French American Indians | 0.0 /100 | #294 | Tragic 33.1% |
| Yaqui | 0.0 /100 | #295 | Tragic 33.1% |
| Blackfeet | 0.0 /100 | #296 | Tragic 33.2% |
| Pennsylvania Germans | 0.0 /100 | #297 | Tragic 33.2% |
| Africans | 0.0 /100 | #298 | Tragic 33.3% |
| Immigrants | Guatemala | 0.0 /100 | #299 | Tragic 33.3% |
| Hispanics or Latinos | 0.0 /100 | #300 | Tragic 33.3% |
| Immigrants | Somalia | 0.0 /100 | #301 | Tragic 33.4% |
| Arapaho | 0.0 /100 | #302 | Tragic 33.4% |
| Americans | 0.0 /100 | #303 | Tragic 33.5% |
| Mexicans | 0.0 /100 | #304 | Tragic 33.6% |
| Immigrants | Central America | 0.0 /100 | #305 | Tragic 33.6% |
| Immigrants | Congo | 0.0 /100 | #306 | Tragic 33.8% |
| Comanche | 0.0 /100 | #307 | Tragic 33.9% |
| Immigrants | Mexico | 0.0 /100 | #308 | Tragic 34.0% |
Demographics Similar to Danes by Single Mother Poverty
In terms of single mother poverty, the demographic groups most similar to Danes are South African (28.5%, a difference of 0.050%), Immigrants from North America (28.5%, a difference of 0.060%), Luxembourger (28.5%, a difference of 0.070%), Immigrants from Colombia (28.5%, a difference of 0.10%), and Samoan (28.5%, a difference of 0.11%).
| Demographics | Rating | Rank | Single Mother Poverty |
| Immigrants | Southern Europe | 89.2 /100 | #134 | Excellent 28.4% |
| Immigrants | Spain | 89.2 /100 | #135 | Excellent 28.4% |
| Native Hawaiians | 88.9 /100 | #136 | Excellent 28.4% |
| Immigrants | Canada | 88.9 /100 | #137 | Excellent 28.4% |
| Immigrants | Belgium | 88.5 /100 | #138 | Excellent 28.5% |
| Samoans | 88.1 /100 | #139 | Excellent 28.5% |
| Immigrants | Colombia | 88.0 /100 | #140 | Excellent 28.5% |
| Danes | 87.1 /100 | #141 | Excellent 28.5% |
| South Africans | 86.6 /100 | #142 | Excellent 28.5% |
| Immigrants | North America | 86.5 /100 | #143 | Excellent 28.5% |
| Luxembourgers | 86.4 /100 | #144 | Excellent 28.5% |
| Immigrants | South America | 86.1 /100 | #145 | Excellent 28.5% |
| Immigrants | Denmark | 86.1 /100 | #146 | Excellent 28.5% |
| Immigrants | Lebanon | 85.3 /100 | #147 | Excellent 28.6% |
| Syrians | 85.3 /100 | #148 | Excellent 28.6% |