Creek vs Carpatho Rusyn Single Mother Poverty
COMPARE
Creek
Carpatho Rusyn
Single Mother Poverty
Single Mother Poverty Comparison
Creek
Carpatho Rusyns
36.7%
SINGLE MOTHER POVERTY
0.0/ 100
METRIC RATING
331st/ 347
METRIC RANK
29.1%
SINGLE MOTHER POVERTY
53.8/ 100
METRIC RATING
172nd/ 347
METRIC RANK
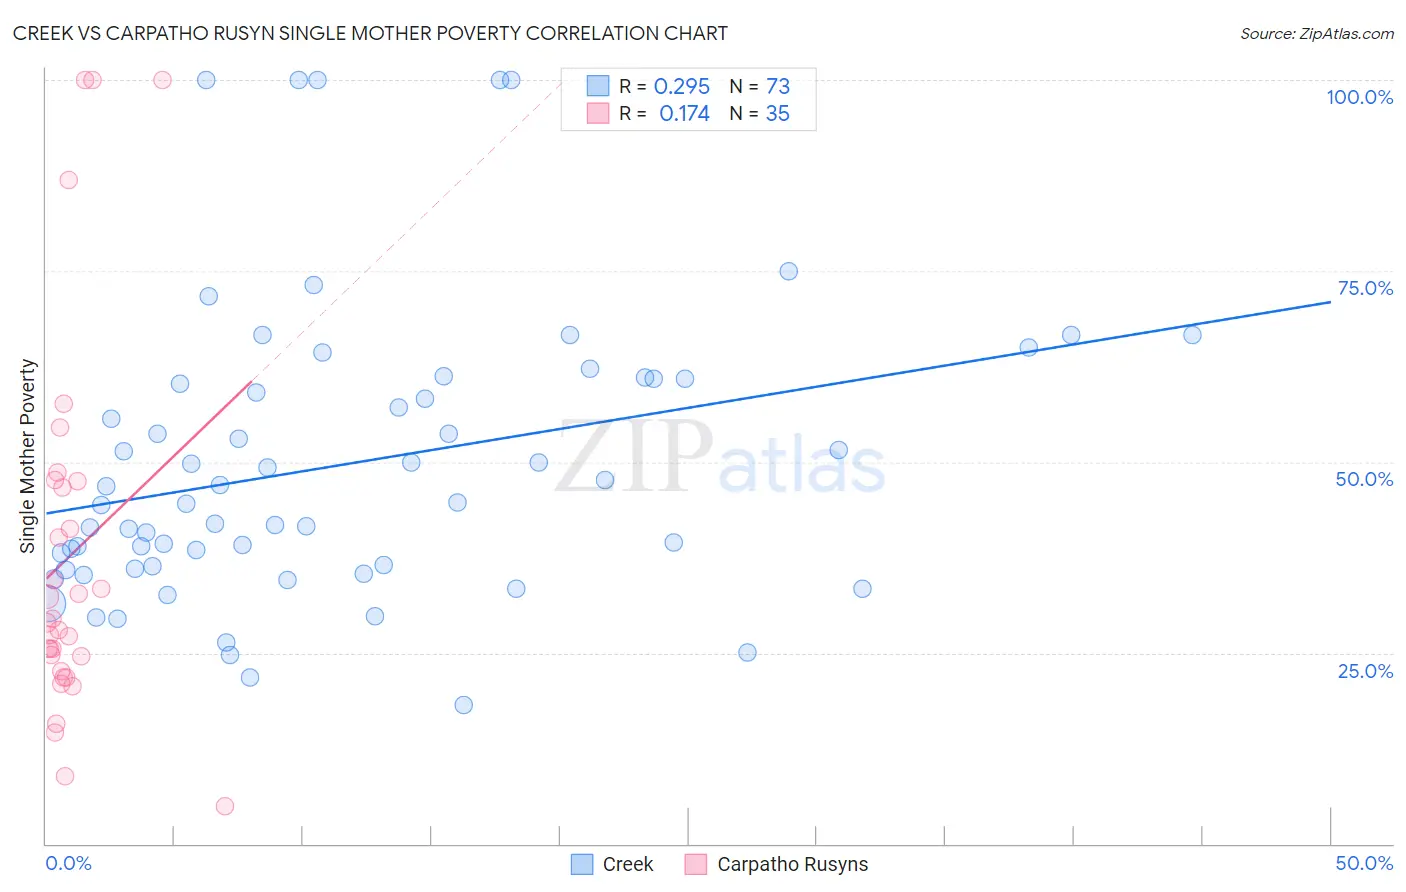
Creek vs Carpatho Rusyn Single Mother Poverty Correlation Chart
The statistical analysis conducted on geographies consisting of 177,086,597 people shows a weak positive correlation between the proportion of Creek and poverty level among single mothers in the United States with a correlation coefficient (R) of 0.295 and weighted average of 36.7%. Similarly, the statistical analysis conducted on geographies consisting of 58,401,773 people shows a poor positive correlation between the proportion of Carpatho Rusyns and poverty level among single mothers in the United States with a correlation coefficient (R) of 0.174 and weighted average of 29.1%, a difference of 26.0%.
Single Mother Poverty Correlation Summary
| Measurement | Creek | Carpatho Rusyn |
| Minimum | 18.2% | 4.9% |
| Maximum | 100.0% | 100.0% |
| Range | 81.8% | 95.1% |
| Mean | 49.7% | 37.8% |
| Median | 44.7% | 28.9% |
| Interquartile 25% (IQ1) | 36.1% | 22.6% |
| Interquartile 75% (IQ3) | 60.9% | 47.5% |
| Interquartile Range (IQR) | 24.8% | 25.0% |
| Standard Deviation (Sample) | 19.0% | 24.7% |
| Standard Deviation (Population) | 18.9% | 24.3% |
Similar Demographics by Single Mother Poverty
Demographics Similar to Creek by Single Mother Poverty
In terms of single mother poverty, the demographic groups most similar to Creek are Native/Alaskan (36.6%, a difference of 0.16%), Dutch West Indian (36.8%, a difference of 0.24%), Apache (36.6%, a difference of 0.26%), Choctaw (36.4%, a difference of 0.74%), and Yakama (36.4%, a difference of 0.79%).
| Demographics | Rating | Rank | Single Mother Poverty |
| Ottawa | 0.0 /100 | #324 | Tragic 35.5% |
| Ute | 0.0 /100 | #325 | Tragic 35.7% |
| Seminole | 0.0 /100 | #326 | Tragic 35.8% |
| Yakama | 0.0 /100 | #327 | Tragic 36.4% |
| Choctaw | 0.0 /100 | #328 | Tragic 36.4% |
| Apache | 0.0 /100 | #329 | Tragic 36.6% |
| Natives/Alaskans | 0.0 /100 | #330 | Tragic 36.6% |
| Creek | 0.0 /100 | #331 | Tragic 36.7% |
| Dutch West Indians | 0.0 /100 | #332 | Tragic 36.8% |
| Menominee | 0.0 /100 | #333 | Tragic 37.1% |
| Pueblo | 0.0 /100 | #334 | Tragic 37.2% |
| Yuman | 0.0 /100 | #335 | Tragic 37.8% |
| Cheyenne | 0.0 /100 | #336 | Tragic 38.5% |
| Immigrants | Yemen | 0.0 /100 | #337 | Tragic 38.5% |
| Pima | 0.0 /100 | #338 | Tragic 38.6% |
Demographics Similar to Carpatho Rusyns by Single Mother Poverty
In terms of single mother poverty, the demographic groups most similar to Carpatho Rusyns are New Zealander (29.1%, a difference of 0.060%), Puget Sound Salish (29.1%, a difference of 0.060%), British (29.2%, a difference of 0.16%), Immigrants from Uruguay (29.1%, a difference of 0.17%), and European (29.1%, a difference of 0.18%).
| Demographics | Rating | Rank | Single Mother Poverty |
| Arabs | 60.7 /100 | #165 | Good 29.0% |
| Inupiat | 60.4 /100 | #166 | Good 29.0% |
| Costa Ricans | 58.4 /100 | #167 | Average 29.0% |
| Europeans | 57.6 /100 | #168 | Average 29.1% |
| Immigrants | Uruguay | 57.2 /100 | #169 | Average 29.1% |
| New Zealanders | 55.1 /100 | #170 | Average 29.1% |
| Puget Sound Salish | 55.1 /100 | #171 | Average 29.1% |
| Carpatho Rusyns | 53.8 /100 | #172 | Average 29.1% |
| British | 50.6 /100 | #173 | Average 29.2% |
| Immigrants | Saudi Arabia | 50.0 /100 | #174 | Average 29.2% |
| Immigrants | Costa Rica | 48.8 /100 | #175 | Average 29.2% |
| Hawaiians | 47.8 /100 | #176 | Average 29.2% |
| Immigrants | Bosnia and Herzegovina | 45.1 /100 | #177 | Average 29.2% |
| South American Indians | 43.2 /100 | #178 | Average 29.3% |
| Immigrants | Uzbekistan | 42.6 /100 | #179 | Average 29.3% |