Creek vs Immigrants from Panama Single Mother Poverty
COMPARE
Creek
Immigrants from Panama
Single Mother Poverty
Single Mother Poverty Comparison
Creek
Immigrants from Panama
36.7%
SINGLE MOTHER POVERTY
0.0/ 100
METRIC RATING
331st/ 347
METRIC RANK
29.8%
SINGLE MOTHER POVERTY
15.5/ 100
METRIC RATING
207th/ 347
METRIC RANK
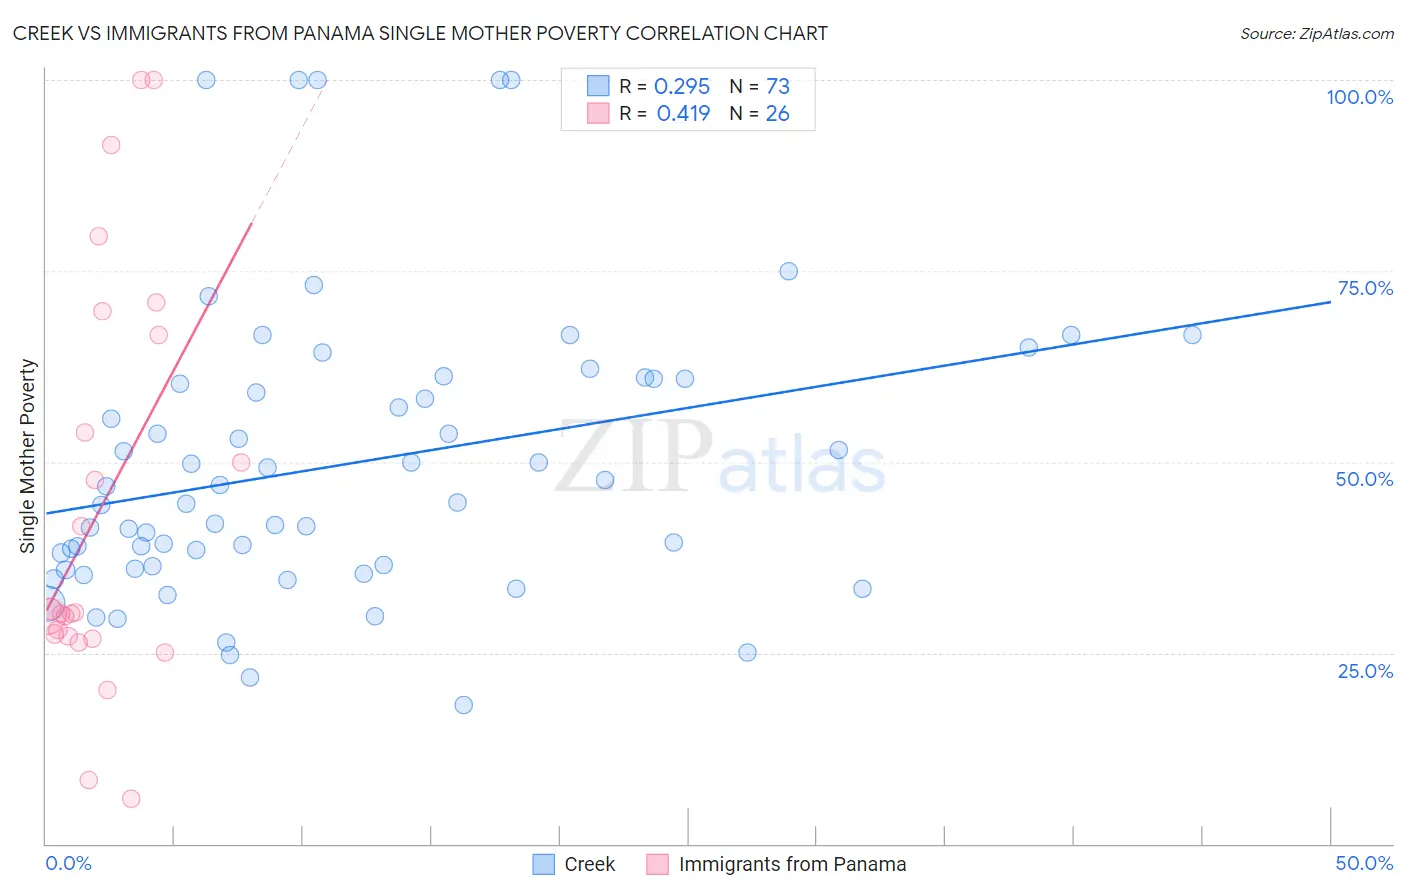
Creek vs Immigrants from Panama Single Mother Poverty Correlation Chart
The statistical analysis conducted on geographies consisting of 177,086,597 people shows a weak positive correlation between the proportion of Creek and poverty level among single mothers in the United States with a correlation coefficient (R) of 0.295 and weighted average of 36.7%. Similarly, the statistical analysis conducted on geographies consisting of 219,078,545 people shows a moderate positive correlation between the proportion of Immigrants from Panama and poverty level among single mothers in the United States with a correlation coefficient (R) of 0.419 and weighted average of 29.8%, a difference of 23.3%.
Single Mother Poverty Correlation Summary
| Measurement | Creek | Immigrants from Panama |
| Minimum | 18.2% | 6.0% |
| Maximum | 100.0% | 100.0% |
| Range | 81.8% | 94.0% |
| Mean | 49.7% | 44.1% |
| Median | 44.7% | 30.2% |
| Interquartile 25% (IQ1) | 36.1% | 27.1% |
| Interquartile 75% (IQ3) | 60.9% | 66.7% |
| Interquartile Range (IQR) | 24.8% | 39.5% |
| Standard Deviation (Sample) | 19.0% | 26.9% |
| Standard Deviation (Population) | 18.9% | 26.4% |
Similar Demographics by Single Mother Poverty
Demographics Similar to Creek by Single Mother Poverty
In terms of single mother poverty, the demographic groups most similar to Creek are Native/Alaskan (36.6%, a difference of 0.16%), Dutch West Indian (36.8%, a difference of 0.24%), Apache (36.6%, a difference of 0.26%), Choctaw (36.4%, a difference of 0.74%), and Yakama (36.4%, a difference of 0.79%).
| Demographics | Rating | Rank | Single Mother Poverty |
| Ottawa | 0.0 /100 | #324 | Tragic 35.5% |
| Ute | 0.0 /100 | #325 | Tragic 35.7% |
| Seminole | 0.0 /100 | #326 | Tragic 35.8% |
| Yakama | 0.0 /100 | #327 | Tragic 36.4% |
| Choctaw | 0.0 /100 | #328 | Tragic 36.4% |
| Apache | 0.0 /100 | #329 | Tragic 36.6% |
| Natives/Alaskans | 0.0 /100 | #330 | Tragic 36.6% |
| Creek | 0.0 /100 | #331 | Tragic 36.7% |
| Dutch West Indians | 0.0 /100 | #332 | Tragic 36.8% |
| Menominee | 0.0 /100 | #333 | Tragic 37.1% |
| Pueblo | 0.0 /100 | #334 | Tragic 37.2% |
| Yuman | 0.0 /100 | #335 | Tragic 37.8% |
| Cheyenne | 0.0 /100 | #336 | Tragic 38.5% |
| Immigrants | Yemen | 0.0 /100 | #337 | Tragic 38.5% |
| Pima | 0.0 /100 | #338 | Tragic 38.6% |
Demographics Similar to Immigrants from Panama by Single Mother Poverty
In terms of single mother poverty, the demographic groups most similar to Immigrants from Panama are Immigrants from Haiti (29.7%, a difference of 0.030%), Czechoslovakian (29.7%, a difference of 0.050%), Immigrants from Guyana (29.8%, a difference of 0.070%), Immigrants (29.7%, a difference of 0.090%), and Swiss (29.7%, a difference of 0.15%).
| Demographics | Rating | Rank | Single Mother Poverty |
| Panamanians | 20.0 /100 | #200 | Fair 29.6% |
| Belgians | 18.8 /100 | #201 | Poor 29.7% |
| Malaysians | 17.4 /100 | #202 | Poor 29.7% |
| Swiss | 17.2 /100 | #203 | Poor 29.7% |
| Immigrants | Immigrants | 16.6 /100 | #204 | Poor 29.7% |
| Czechoslovakians | 16.1 /100 | #205 | Poor 29.7% |
| Immigrants | Haiti | 15.8 /100 | #206 | Poor 29.7% |
| Immigrants | Panama | 15.5 /100 | #207 | Poor 29.8% |
| Immigrants | Guyana | 14.7 /100 | #208 | Poor 29.8% |
| Irish | 13.9 /100 | #209 | Poor 29.8% |
| Haitians | 13.3 /100 | #210 | Poor 29.8% |
| Guyanese | 12.8 /100 | #211 | Poor 29.8% |
| Nicaraguans | 12.4 /100 | #212 | Poor 29.8% |
| Immigrants | Thailand | 12.0 /100 | #213 | Poor 29.9% |
| Liberians | 11.7 /100 | #214 | Poor 29.9% |