Immigrants from Eastern Africa vs Danish Single Mother Poverty
COMPARE
Immigrants from Eastern Africa
Danish
Single Mother Poverty
Single Mother Poverty Comparison
Immigrants from Eastern Africa
Danes
29.3%
SINGLE MOTHER POVERTY
38.5/ 100
METRIC RATING
182nd/ 347
METRIC RANK
28.5%
SINGLE MOTHER POVERTY
87.1/ 100
METRIC RATING
141st/ 347
METRIC RANK
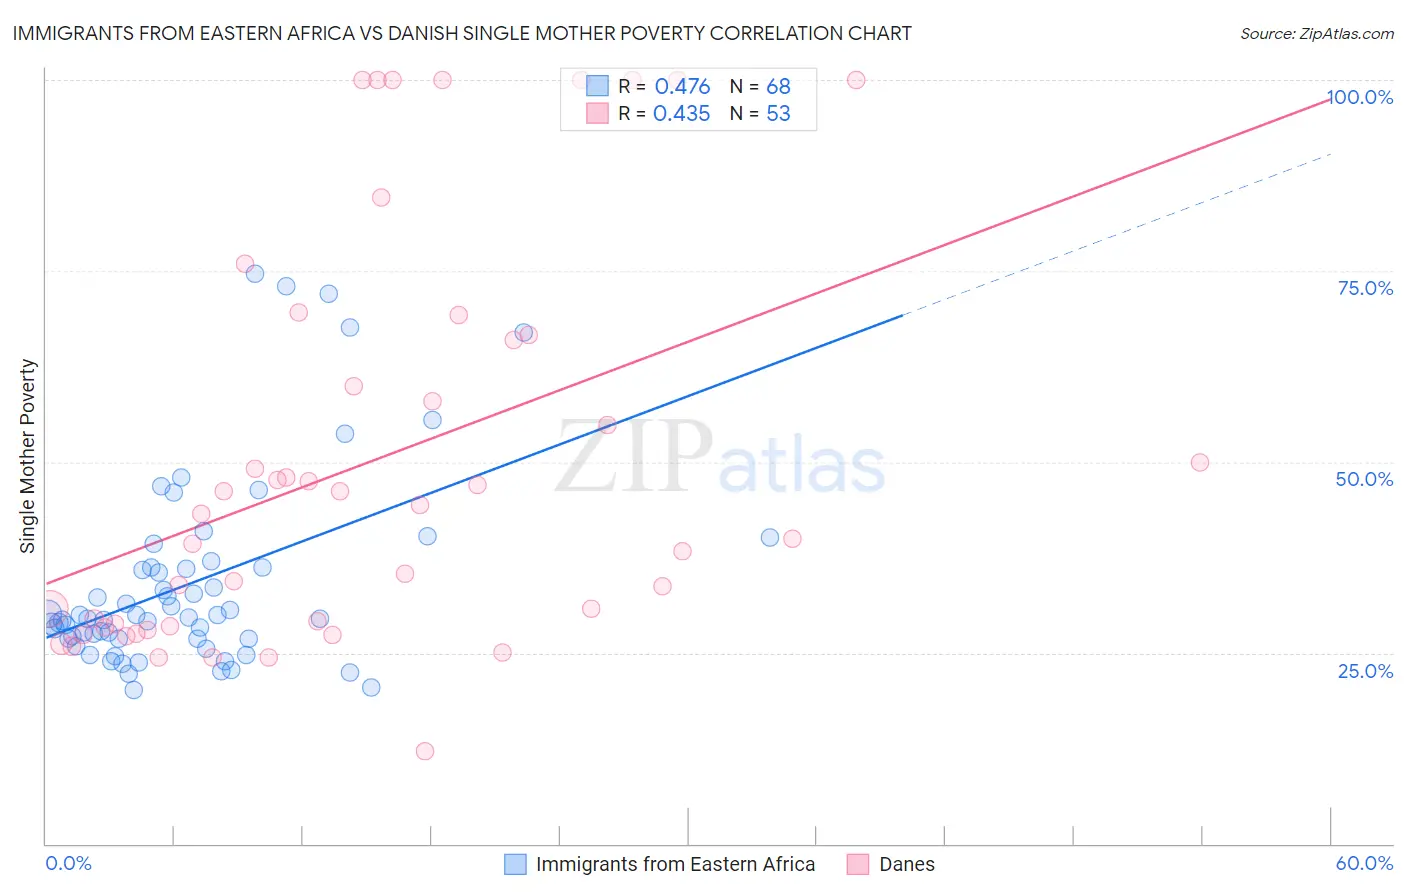
Immigrants from Eastern Africa vs Danish Single Mother Poverty Correlation Chart
The statistical analysis conducted on geographies consisting of 348,777,733 people shows a moderate positive correlation between the proportion of Immigrants from Eastern Africa and poverty level among single mothers in the United States with a correlation coefficient (R) of 0.476 and weighted average of 29.3%. Similarly, the statistical analysis conducted on geographies consisting of 456,210,037 people shows a moderate positive correlation between the proportion of Danes and poverty level among single mothers in the United States with a correlation coefficient (R) of 0.435 and weighted average of 28.5%, a difference of 2.9%.
Single Mother Poverty Correlation Summary
| Measurement | Immigrants from Eastern Africa | Danish |
| Minimum | 20.2% | 12.1% |
| Maximum | 74.6% | 100.0% |
| Range | 54.4% | 87.9% |
| Mean | 34.1% | 49.7% |
| Median | 29.5% | 43.2% |
| Interquartile 25% (IQ1) | 26.8% | 28.4% |
| Interquartile 75% (IQ3) | 36.1% | 66.3% |
| Interquartile Range (IQR) | 9.3% | 37.9% |
| Standard Deviation (Sample) | 12.8% | 26.1% |
| Standard Deviation (Population) | 12.7% | 25.9% |
Similar Demographics by Single Mother Poverty
Demographics Similar to Immigrants from Eastern Africa by Single Mother Poverty
In terms of single mother poverty, the demographic groups most similar to Immigrants from Eastern Africa are Nepalese (29.3%, a difference of 0.010%), Nigerian (29.3%, a difference of 0.030%), Canadian (29.3%, a difference of 0.090%), Ghanaian (29.4%, a difference of 0.090%), and Yugoslavian (29.4%, a difference of 0.13%).
| Demographics | Rating | Rank | Single Mother Poverty |
| Immigrants | Costa Rica | 48.8 /100 | #175 | Average 29.2% |
| Hawaiians | 47.8 /100 | #176 | Average 29.2% |
| Immigrants | Bosnia and Herzegovina | 45.1 /100 | #177 | Average 29.2% |
| South American Indians | 43.2 /100 | #178 | Average 29.3% |
| Immigrants | Uzbekistan | 42.6 /100 | #179 | Average 29.3% |
| Immigrants | Norway | 41.5 /100 | #180 | Average 29.3% |
| Canadians | 40.4 /100 | #181 | Average 29.3% |
| Immigrants | Eastern Africa | 38.5 /100 | #182 | Fair 29.3% |
| Nepalese | 38.3 /100 | #183 | Fair 29.3% |
| Nigerians | 38.0 /100 | #184 | Fair 29.3% |
| Ghanaians | 36.8 /100 | #185 | Fair 29.4% |
| Yugoslavians | 36.0 /100 | #186 | Fair 29.4% |
| Lebanese | 32.5 /100 | #187 | Fair 29.4% |
| Guamanians/Chamorros | 31.8 /100 | #188 | Fair 29.4% |
| Immigrants | Africa | 31.6 /100 | #189 | Fair 29.4% |
Demographics Similar to Danes by Single Mother Poverty
In terms of single mother poverty, the demographic groups most similar to Danes are South African (28.5%, a difference of 0.050%), Immigrants from North America (28.5%, a difference of 0.060%), Luxembourger (28.5%, a difference of 0.070%), Immigrants from Colombia (28.5%, a difference of 0.10%), and Samoan (28.5%, a difference of 0.11%).
| Demographics | Rating | Rank | Single Mother Poverty |
| Immigrants | Southern Europe | 89.2 /100 | #134 | Excellent 28.4% |
| Immigrants | Spain | 89.2 /100 | #135 | Excellent 28.4% |
| Native Hawaiians | 88.9 /100 | #136 | Excellent 28.4% |
| Immigrants | Canada | 88.9 /100 | #137 | Excellent 28.4% |
| Immigrants | Belgium | 88.5 /100 | #138 | Excellent 28.5% |
| Samoans | 88.1 /100 | #139 | Excellent 28.5% |
| Immigrants | Colombia | 88.0 /100 | #140 | Excellent 28.5% |
| Danes | 87.1 /100 | #141 | Excellent 28.5% |
| South Africans | 86.6 /100 | #142 | Excellent 28.5% |
| Immigrants | North America | 86.5 /100 | #143 | Excellent 28.5% |
| Luxembourgers | 86.4 /100 | #144 | Excellent 28.5% |
| Immigrants | South America | 86.1 /100 | #145 | Excellent 28.5% |
| Immigrants | Denmark | 86.1 /100 | #146 | Excellent 28.5% |
| Immigrants | Lebanon | 85.3 /100 | #147 | Excellent 28.6% |
| Syrians | 85.3 /100 | #148 | Excellent 28.6% |