Cree vs Immigrants from Micronesia Male Unemployment
COMPARE
Cree
Immigrants from Micronesia
Male Unemployment
Male Unemployment Comparison
Cree
Immigrants from Micronesia
5.7%
MALE UNEMPLOYMENT
0.4/ 100
METRIC RATING
249th/ 347
METRIC RANK
5.6%
MALE UNEMPLOYMENT
2.9/ 100
METRIC RATING
222nd/ 347
METRIC RANK
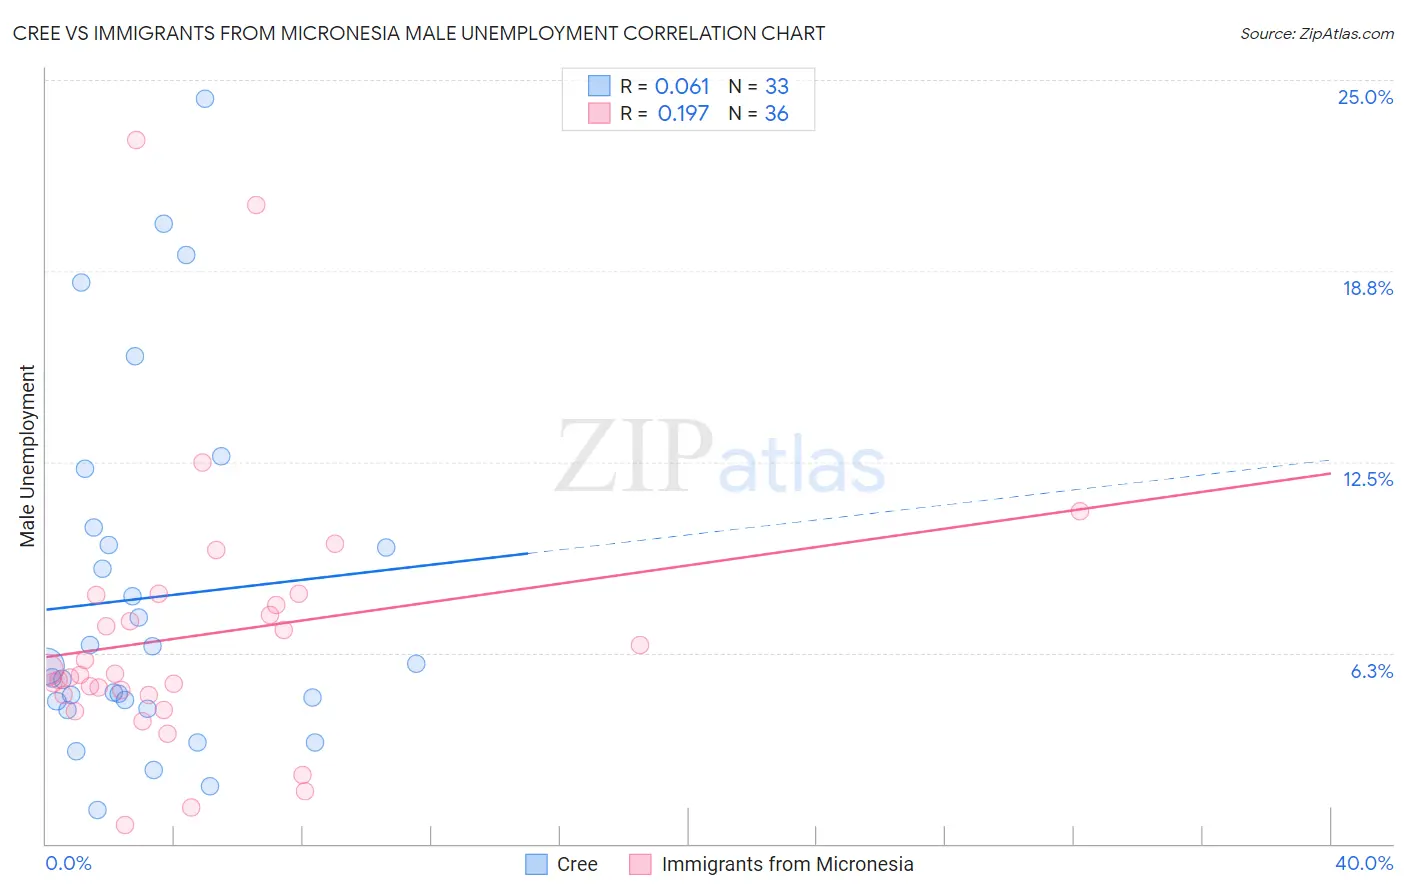
Cree vs Immigrants from Micronesia Male Unemployment Correlation Chart
The statistical analysis conducted on geographies consisting of 76,096,114 people shows a slight positive correlation between the proportion of Cree and unemployment rate among males in the United States with a correlation coefficient (R) of 0.061 and weighted average of 5.7%. Similarly, the statistical analysis conducted on geographies consisting of 61,517,002 people shows a poor positive correlation between the proportion of Immigrants from Micronesia and unemployment rate among males in the United States with a correlation coefficient (R) of 0.197 and weighted average of 5.6%, a difference of 2.7%.
Male Unemployment Correlation Summary
| Measurement | Cree | Immigrants from Micronesia |
| Minimum | 1.1% | 0.60% |
| Maximum | 24.4% | 23.0% |
| Range | 23.3% | 22.4% |
| Mean | 8.1% | 6.8% |
| Median | 5.8% | 5.5% |
| Interquartile 25% (IQ1) | 4.5% | 4.9% |
| Interquartile 75% (IQ3) | 10.1% | 8.0% |
| Interquartile Range (IQR) | 5.5% | 3.1% |
| Standard Deviation (Sample) | 5.8% | 4.5% |
| Standard Deviation (Population) | 5.7% | 4.4% |
Similar Demographics by Male Unemployment
Demographics Similar to Cree by Male Unemployment
In terms of male unemployment, the demographic groups most similar to Cree are Marshallese (5.7%, a difference of 0.070%), Immigrants from Bahamas (5.7%, a difference of 0.24%), Spanish American (5.7%, a difference of 0.29%), Hawaiian (5.7%, a difference of 0.39%), and Iroquois (5.7%, a difference of 0.48%).
| Demographics | Rating | Rank | Male Unemployment |
| Ottawa | 0.9 /100 | #242 | Tragic 5.7% |
| Bangladeshis | 0.8 /100 | #243 | Tragic 5.7% |
| Immigrants | El Salvador | 0.7 /100 | #244 | Tragic 5.7% |
| Yaqui | 0.7 /100 | #245 | Tragic 5.7% |
| Iroquois | 0.6 /100 | #246 | Tragic 5.7% |
| Hawaiians | 0.6 /100 | #247 | Tragic 5.7% |
| Marshallese | 0.5 /100 | #248 | Tragic 5.7% |
| Cree | 0.4 /100 | #249 | Tragic 5.7% |
| Immigrants | Bahamas | 0.4 /100 | #250 | Tragic 5.7% |
| Spanish Americans | 0.3 /100 | #251 | Tragic 5.7% |
| Mexicans | 0.2 /100 | #252 | Tragic 5.8% |
| Mexican American Indians | 0.2 /100 | #253 | Tragic 5.8% |
| Japanese | 0.2 /100 | #254 | Tragic 5.8% |
| Kiowa | 0.2 /100 | #255 | Tragic 5.8% |
| Comanche | 0.2 /100 | #256 | Tragic 5.8% |
Demographics Similar to Immigrants from Micronesia by Male Unemployment
In terms of male unemployment, the demographic groups most similar to Immigrants from Micronesia are Soviet Union (5.6%, a difference of 0.14%), Creek (5.6%, a difference of 0.15%), Portuguese (5.6%, a difference of 0.25%), Immigrants from Western Asia (5.6%, a difference of 0.27%), and Cherokee (5.6%, a difference of 0.28%).
| Demographics | Rating | Rank | Male Unemployment |
| Samoans | 4.9 /100 | #215 | Tragic 5.5% |
| Immigrants | Immigrants | 4.3 /100 | #216 | Tragic 5.5% |
| Delaware | 4.2 /100 | #217 | Tragic 5.5% |
| Immigrants | Albania | 3.6 /100 | #218 | Tragic 5.5% |
| Immigrants | Western Asia | 3.5 /100 | #219 | Tragic 5.6% |
| Portuguese | 3.5 /100 | #220 | Tragic 5.6% |
| Soviet Union | 3.2 /100 | #221 | Tragic 5.6% |
| Immigrants | Micronesia | 2.9 /100 | #222 | Tragic 5.6% |
| Creek | 2.6 /100 | #223 | Tragic 5.6% |
| Cherokee | 2.4 /100 | #224 | Tragic 5.6% |
| Panamanians | 1.9 /100 | #225 | Tragic 5.6% |
| Immigrants | Cambodia | 1.8 /100 | #226 | Tragic 5.6% |
| Immigrants | Panama | 1.8 /100 | #227 | Tragic 5.6% |
| Seminole | 1.8 /100 | #228 | Tragic 5.6% |
| Central Americans | 1.8 /100 | #229 | Tragic 5.6% |