Cree vs Immigrants from Micronesia In Labor Force | Age 30-34
COMPARE
Cree
Immigrants from Micronesia
In Labor Force | Age 30-34
In Labor Force | Age 30-34 Comparison
Cree
Immigrants from Micronesia
83.2%
IN LABOR FORCE | AGE 30-34
0.0/ 100
METRIC RATING
285th/ 347
METRIC RANK
82.4%
IN LABOR FORCE | AGE 30-34
0.0/ 100
METRIC RATING
303rd/ 347
METRIC RANK
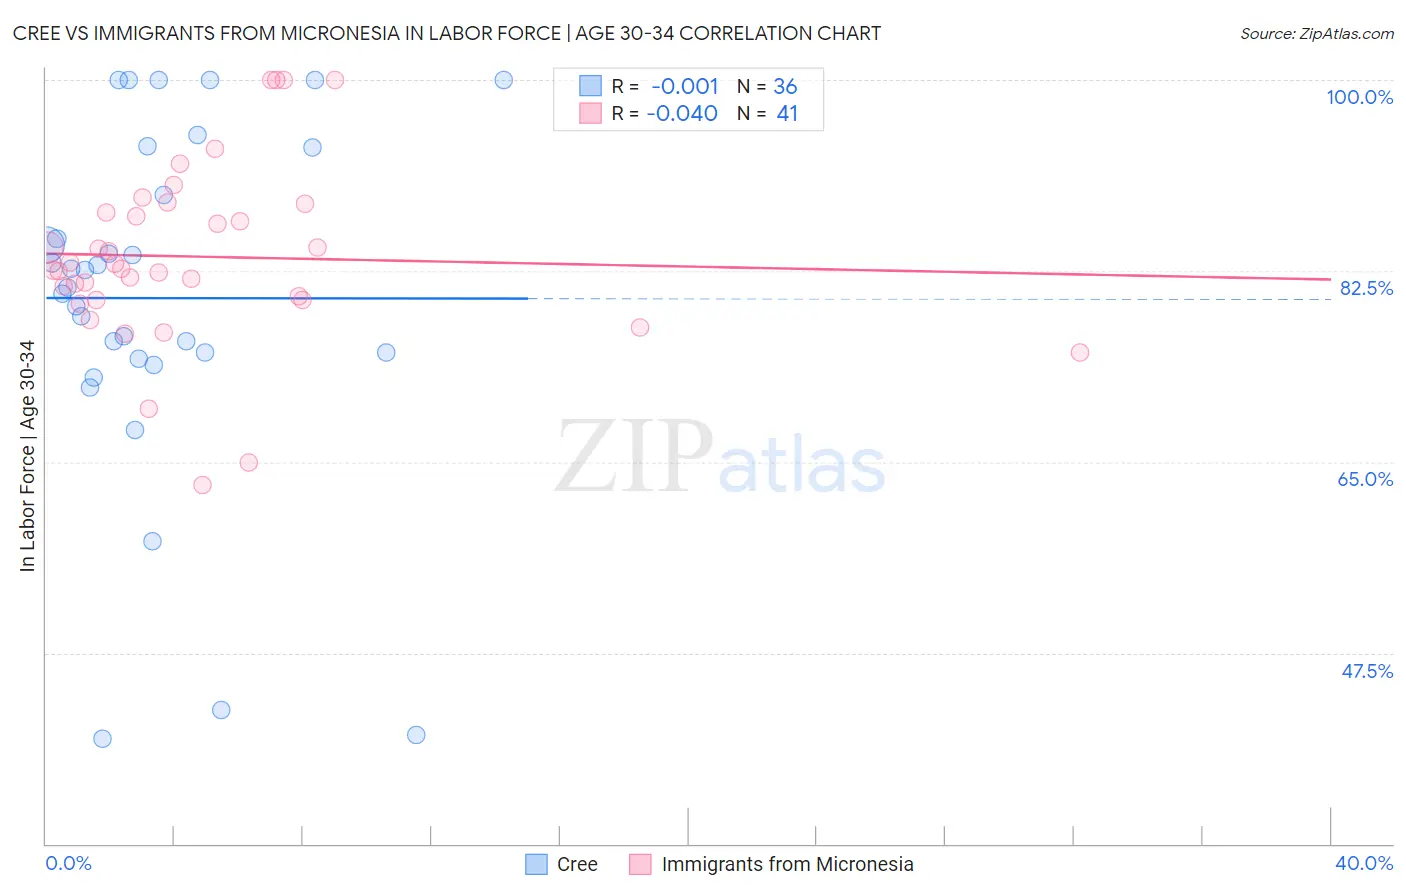
Cree vs Immigrants from Micronesia In Labor Force | Age 30-34 Correlation Chart
The statistical analysis conducted on geographies consisting of 76,199,650 people shows no correlation between the proportion of Cree and labor force participation rate among population between the ages 30 and 34 in the United States with a correlation coefficient (R) of -0.001 and weighted average of 83.2%. Similarly, the statistical analysis conducted on geographies consisting of 61,597,268 people shows no correlation between the proportion of Immigrants from Micronesia and labor force participation rate among population between the ages 30 and 34 in the United States with a correlation coefficient (R) of -0.040 and weighted average of 82.4%, a difference of 0.96%.
In Labor Force | Age 30-34 Correlation Summary
| Measurement | Cree | Immigrants from Micronesia |
| Minimum | 39.6% | 62.9% |
| Maximum | 100.0% | 100.0% |
| Range | 60.4% | 37.1% |
| Mean | 80.0% | 83.8% |
| Median | 81.8% | 82.7% |
| Interquartile 25% (IQ1) | 74.7% | 79.9% |
| Interquartile 75% (IQ3) | 91.7% | 88.3% |
| Interquartile Range (IQR) | 17.0% | 8.4% |
| Standard Deviation (Sample) | 15.9% | 8.3% |
| Standard Deviation (Population) | 15.6% | 8.1% |
Demographics Similar to Cree and Immigrants from Micronesia by In Labor Force | Age 30-34
In terms of in labor force | age 30-34, the demographic groups most similar to Cree are Immigrants from Belize (83.2%, a difference of 0.0%), Immigrants from Latin America (83.1%, a difference of 0.060%), Native Hawaiian (83.0%, a difference of 0.16%), Central American Indian (83.0%, a difference of 0.20%), and Hawaiian (83.0%, a difference of 0.21%). Similarly, the demographic groups most similar to Immigrants from Micronesia are Ottawa (82.4%, a difference of 0.010%), Hispanic or Latino (82.4%, a difference of 0.040%), Hmong (82.4%, a difference of 0.050%), Tlingit-Haida (82.3%, a difference of 0.080%), and Immigrants from Central America (82.5%, a difference of 0.11%).
| Demographics | Rating | Rank | In Labor Force | Age 30-34 |
| Immigrants | Belize | 0.0 /100 | #284 | Tragic 83.2% |
| Cree | 0.0 /100 | #285 | Tragic 83.2% |
| Immigrants | Latin America | 0.0 /100 | #286 | Tragic 83.1% |
| Native Hawaiians | 0.0 /100 | #287 | Tragic 83.0% |
| Central American Indians | 0.0 /100 | #288 | Tragic 83.0% |
| Hawaiians | 0.0 /100 | #289 | Tragic 83.0% |
| Blackfeet | 0.0 /100 | #290 | Tragic 82.8% |
| Potawatomi | 0.0 /100 | #291 | Tragic 82.8% |
| Blacks/African Americans | 0.0 /100 | #292 | Tragic 82.8% |
| Nepalese | 0.0 /100 | #293 | Tragic 82.7% |
| Americans | 0.0 /100 | #294 | Tragic 82.7% |
| Pennsylvania Germans | 0.0 /100 | #295 | Tragic 82.6% |
| Chippewa | 0.0 /100 | #296 | Tragic 82.6% |
| Comanche | 0.0 /100 | #297 | Tragic 82.6% |
| Aleuts | 0.0 /100 | #298 | Tragic 82.6% |
| Immigrants | Central America | 0.0 /100 | #299 | Tragic 82.5% |
| Hmong | 0.0 /100 | #300 | Tragic 82.4% |
| Hispanics or Latinos | 0.0 /100 | #301 | Tragic 82.4% |
| Ottawa | 0.0 /100 | #302 | Tragic 82.4% |
| Immigrants | Micronesia | 0.0 /100 | #303 | Tragic 82.4% |
| Tlingit-Haida | 0.0 /100 | #304 | Tragic 82.3% |