Cree vs Estonian Cognitive Disability
COMPARE
Cree
Estonian
Cognitive Disability
Cognitive Disability Comparison
Cree
Estonians
17.9%
COGNITIVE DISABILITY
0.7/ 100
METRIC RATING
249th/ 347
METRIC RANK
16.7%
COGNITIVE DISABILITY
99.3/ 100
METRIC RATING
75th/ 347
METRIC RANK
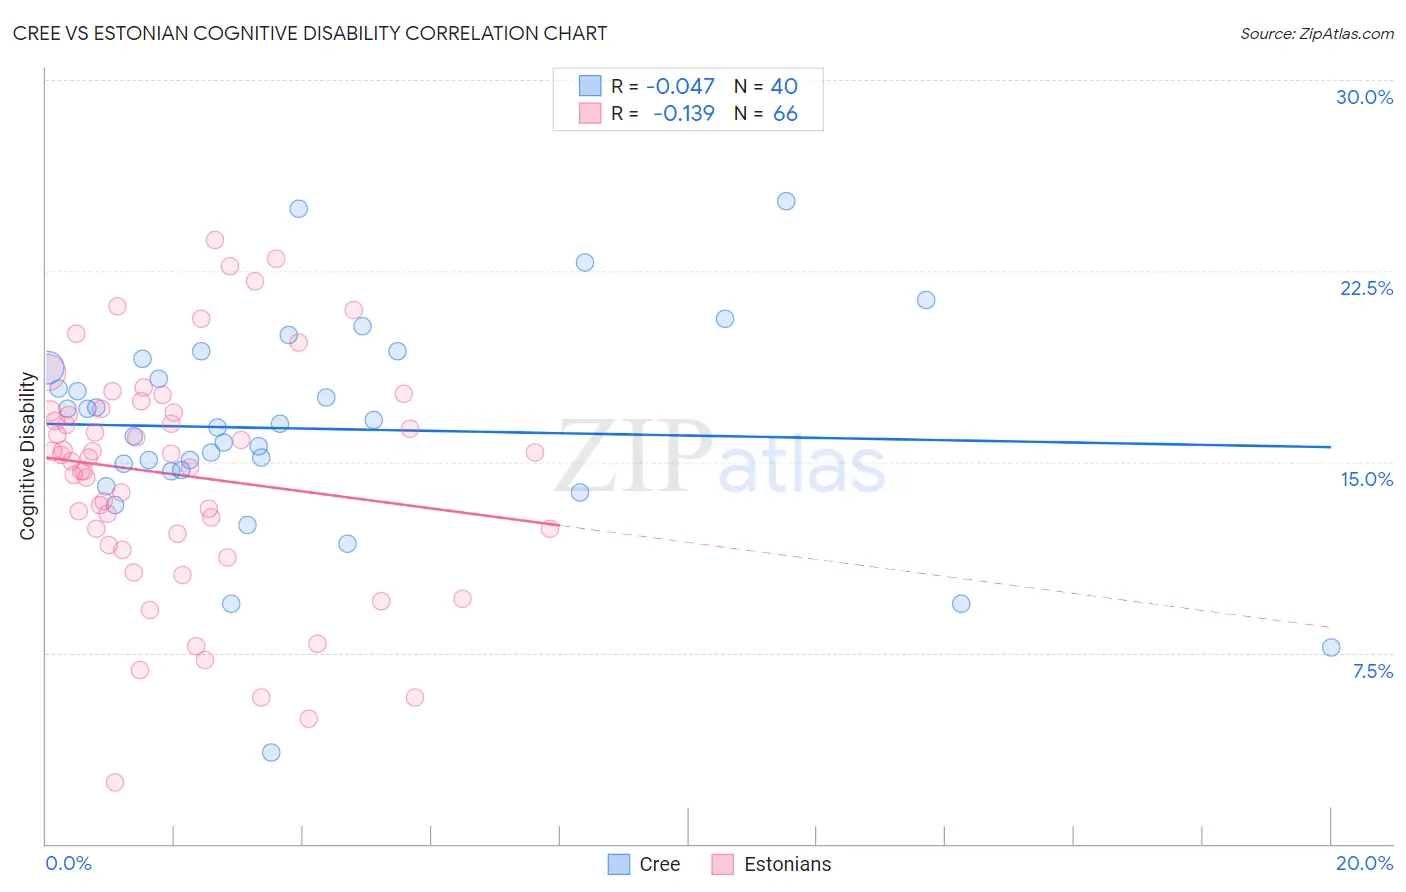
Cree vs Estonian Cognitive Disability Correlation Chart
The statistical analysis conducted on geographies consisting of 76,210,632 people shows no correlation between the proportion of Cree and percentage of population with cognitive disability in the United States with a correlation coefficient (R) of -0.047 and weighted average of 17.9%. Similarly, the statistical analysis conducted on geographies consisting of 123,512,744 people shows a poor negative correlation between the proportion of Estonians and percentage of population with cognitive disability in the United States with a correlation coefficient (R) of -0.139 and weighted average of 16.7%, a difference of 7.4%.
Cognitive Disability Correlation Summary
| Measurement | Cree | Estonian |
| Minimum | 3.6% | 2.4% |
| Maximum | 25.2% | 23.7% |
| Range | 21.7% | 21.3% |
| Mean | 16.3% | 14.5% |
| Median | 16.4% | 15.2% |
| Interquartile 25% (IQ1) | 14.7% | 12.2% |
| Interquartile 75% (IQ3) | 18.9% | 17.0% |
| Interquartile Range (IQR) | 4.2% | 4.8% |
| Standard Deviation (Sample) | 4.3% | 4.5% |
| Standard Deviation (Population) | 4.2% | 4.5% |
Similar Demographics by Cognitive Disability
Demographics Similar to Cree by Cognitive Disability
In terms of cognitive disability, the demographic groups most similar to Cree are Immigrants from Ethiopia (17.9%, a difference of 0.0%), Malaysian (17.9%, a difference of 0.010%), Immigrants from Grenada (17.9%, a difference of 0.020%), Hopi (17.9%, a difference of 0.030%), and Hispanic or Latino (17.9%, a difference of 0.030%).
| Demographics | Rating | Rank | Cognitive Disability |
| Paiute | 1.1 /100 | #242 | Tragic 17.8% |
| Immigrants | Bangladesh | 1.0 /100 | #243 | Tragic 17.8% |
| Jamaicans | 0.9 /100 | #244 | Tragic 17.9% |
| Trinidadians and Tobagonians | 0.8 /100 | #245 | Tragic 17.9% |
| Immigrants | Thailand | 0.8 /100 | #246 | Tragic 17.9% |
| Samoans | 0.7 /100 | #247 | Tragic 17.9% |
| French American Indians | 0.7 /100 | #248 | Tragic 17.9% |
| Cree | 0.7 /100 | #249 | Tragic 17.9% |
| Immigrants | Ethiopia | 0.7 /100 | #250 | Tragic 17.9% |
| Malaysians | 0.6 /100 | #251 | Tragic 17.9% |
| Immigrants | Grenada | 0.6 /100 | #252 | Tragic 17.9% |
| Hopi | 0.6 /100 | #253 | Tragic 17.9% |
| Hispanics or Latinos | 0.6 /100 | #254 | Tragic 17.9% |
| Immigrants | Azores | 0.6 /100 | #255 | Tragic 17.9% |
| Bahamians | 0.6 /100 | #256 | Tragic 17.9% |
Demographics Similar to Estonians by Cognitive Disability
In terms of cognitive disability, the demographic groups most similar to Estonians are Burmese (16.7%, a difference of 0.010%), Slavic (16.7%, a difference of 0.010%), German (16.7%, a difference of 0.020%), Immigrants from Serbia (16.7%, a difference of 0.020%), and Immigrants from Belgium (16.7%, a difference of 0.030%).
| Demographics | Rating | Rank | Cognitive Disability |
| Ukrainians | 99.4 /100 | #68 | Exceptional 16.6% |
| Immigrants | Uzbekistan | 99.4 /100 | #69 | Exceptional 16.7% |
| Immigrants | Sweden | 99.4 /100 | #70 | Exceptional 16.7% |
| Immigrants | Belgium | 99.3 /100 | #71 | Exceptional 16.7% |
| Germans | 99.3 /100 | #72 | Exceptional 16.7% |
| Burmese | 99.3 /100 | #73 | Exceptional 16.7% |
| Slavs | 99.3 /100 | #74 | Exceptional 16.7% |
| Estonians | 99.3 /100 | #75 | Exceptional 16.7% |
| Immigrants | Serbia | 99.3 /100 | #76 | Exceptional 16.7% |
| Immigrants | Hungary | 99.3 /100 | #77 | Exceptional 16.7% |
| Peruvians | 99.3 /100 | #78 | Exceptional 16.7% |
| Immigrants | Bulgaria | 99.3 /100 | #79 | Exceptional 16.7% |
| Egyptians | 99.2 /100 | #80 | Exceptional 16.7% |
| Immigrants | Netherlands | 99.2 /100 | #81 | Exceptional 16.7% |
| Swiss | 99.2 /100 | #82 | Exceptional 16.7% |