Immigrants from Grenada vs Marshallese Poverty
COMPARE
Immigrants from Grenada
Marshallese
Poverty
Poverty Comparison
Immigrants from Grenada
Marshallese
15.8%
POVERTY
0.0/ 100
METRIC RATING
313th/ 347
METRIC RANK
13.4%
POVERTY
2.2/ 100
METRIC RATING
226th/ 347
METRIC RANK
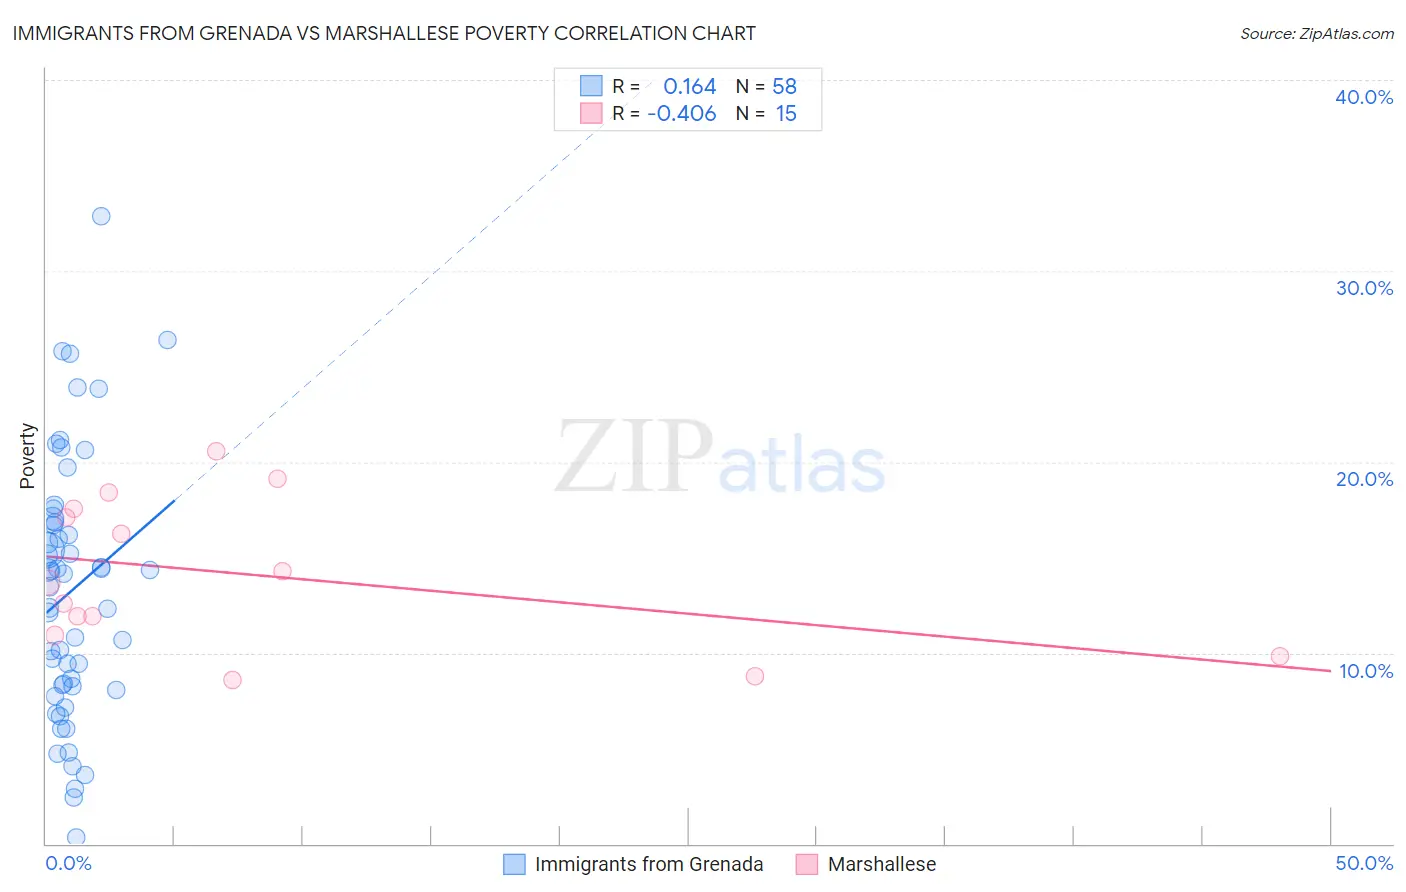
Immigrants from Grenada vs Marshallese Poverty Correlation Chart
The statistical analysis conducted on geographies consisting of 67,200,374 people shows a poor positive correlation between the proportion of Immigrants from Grenada and poverty level in the United States with a correlation coefficient (R) of 0.164 and weighted average of 15.8%. Similarly, the statistical analysis conducted on geographies consisting of 14,760,991 people shows a moderate negative correlation between the proportion of Marshallese and poverty level in the United States with a correlation coefficient (R) of -0.406 and weighted average of 13.4%, a difference of 17.3%.
Poverty Correlation Summary
| Measurement | Immigrants from Grenada | Marshallese |
| Minimum | 0.33% | 8.6% |
| Maximum | 32.9% | 20.5% |
| Range | 32.6% | 12.0% |
| Mean | 13.2% | 14.1% |
| Median | 13.8% | 13.7% |
| Interquartile 25% (IQ1) | 8.2% | 10.9% |
| Interquartile 75% (IQ3) | 16.8% | 17.5% |
| Interquartile Range (IQR) | 8.6% | 6.6% |
| Standard Deviation (Sample) | 6.8% | 3.9% |
| Standard Deviation (Population) | 6.8% | 3.7% |
Similar Demographics by Poverty
Demographics Similar to Immigrants from Grenada by Poverty
In terms of poverty, the demographic groups most similar to Immigrants from Grenada are Immigrants from Somalia (15.8%, a difference of 0.12%), Cajun (15.7%, a difference of 0.44%), British West Indian (15.9%, a difference of 0.49%), Honduran (15.9%, a difference of 0.49%), and Chippewa (15.7%, a difference of 0.60%).
| Demographics | Rating | Rank | Poverty |
| Creek | 0.0 /100 | #306 | Tragic 15.6% |
| Africans | 0.0 /100 | #307 | Tragic 15.6% |
| Choctaw | 0.0 /100 | #308 | Tragic 15.6% |
| Seminole | 0.0 /100 | #309 | Tragic 15.6% |
| Dutch West Indians | 0.0 /100 | #310 | Tragic 15.6% |
| Chippewa | 0.0 /100 | #311 | Tragic 15.7% |
| Cajuns | 0.0 /100 | #312 | Tragic 15.7% |
| Immigrants | Grenada | 0.0 /100 | #313 | Tragic 15.8% |
| Immigrants | Somalia | 0.0 /100 | #314 | Tragic 15.8% |
| British West Indians | 0.0 /100 | #315 | Tragic 15.9% |
| Hondurans | 0.0 /100 | #316 | Tragic 15.9% |
| U.S. Virgin Islanders | 0.0 /100 | #317 | Tragic 16.1% |
| Immigrants | Dominica | 0.0 /100 | #318 | Tragic 16.1% |
| Immigrants | Congo | 0.0 /100 | #319 | Tragic 16.1% |
| Immigrants | Honduras | 0.0 /100 | #320 | Tragic 16.2% |
Demographics Similar to Marshallese by Poverty
In terms of poverty, the demographic groups most similar to Marshallese are German Russian (13.4%, a difference of 0.010%), Alaska Native (13.5%, a difference of 0.15%), Immigrants from Eritrea (13.4%, a difference of 0.23%), Immigrants from Africa (13.4%, a difference of 0.33%), and Immigrants from Micronesia (13.4%, a difference of 0.36%).
| Demographics | Rating | Rank | Poverty |
| Immigrants | Cambodia | 3.0 /100 | #219 | Tragic 13.4% |
| Americans | 2.9 /100 | #220 | Tragic 13.4% |
| Alsatians | 2.6 /100 | #221 | Tragic 13.4% |
| Immigrants | Micronesia | 2.6 /100 | #222 | Tragic 13.4% |
| Immigrants | Africa | 2.5 /100 | #223 | Tragic 13.4% |
| Immigrants | Eritrea | 2.4 /100 | #224 | Tragic 13.4% |
| German Russians | 2.2 /100 | #225 | Tragic 13.4% |
| Marshallese | 2.2 /100 | #226 | Tragic 13.4% |
| Alaska Natives | 2.1 /100 | #227 | Tragic 13.5% |
| Immigrants | Nigeria | 1.7 /100 | #228 | Tragic 13.5% |
| Osage | 1.5 /100 | #229 | Tragic 13.6% |
| Alaskan Athabascans | 1.5 /100 | #230 | Tragic 13.6% |
| Nigerians | 1.4 /100 | #231 | Tragic 13.6% |
| Fijians | 0.8 /100 | #232 | Tragic 13.7% |
| Immigrants | Saudi Arabia | 0.8 /100 | #233 | Tragic 13.8% |