Comanche vs Russian Single Father Poverty
COMPARE
Comanche
Russian
Single Father Poverty
Single Father Poverty Comparison
Comanche
Russians
18.5%
SINGLE FATHER POVERTY
0.0/ 100
METRIC RATING
302nd/ 347
METRIC RANK
16.4%
SINGLE FATHER POVERTY
30.1/ 100
METRIC RATING
188th/ 347
METRIC RANK
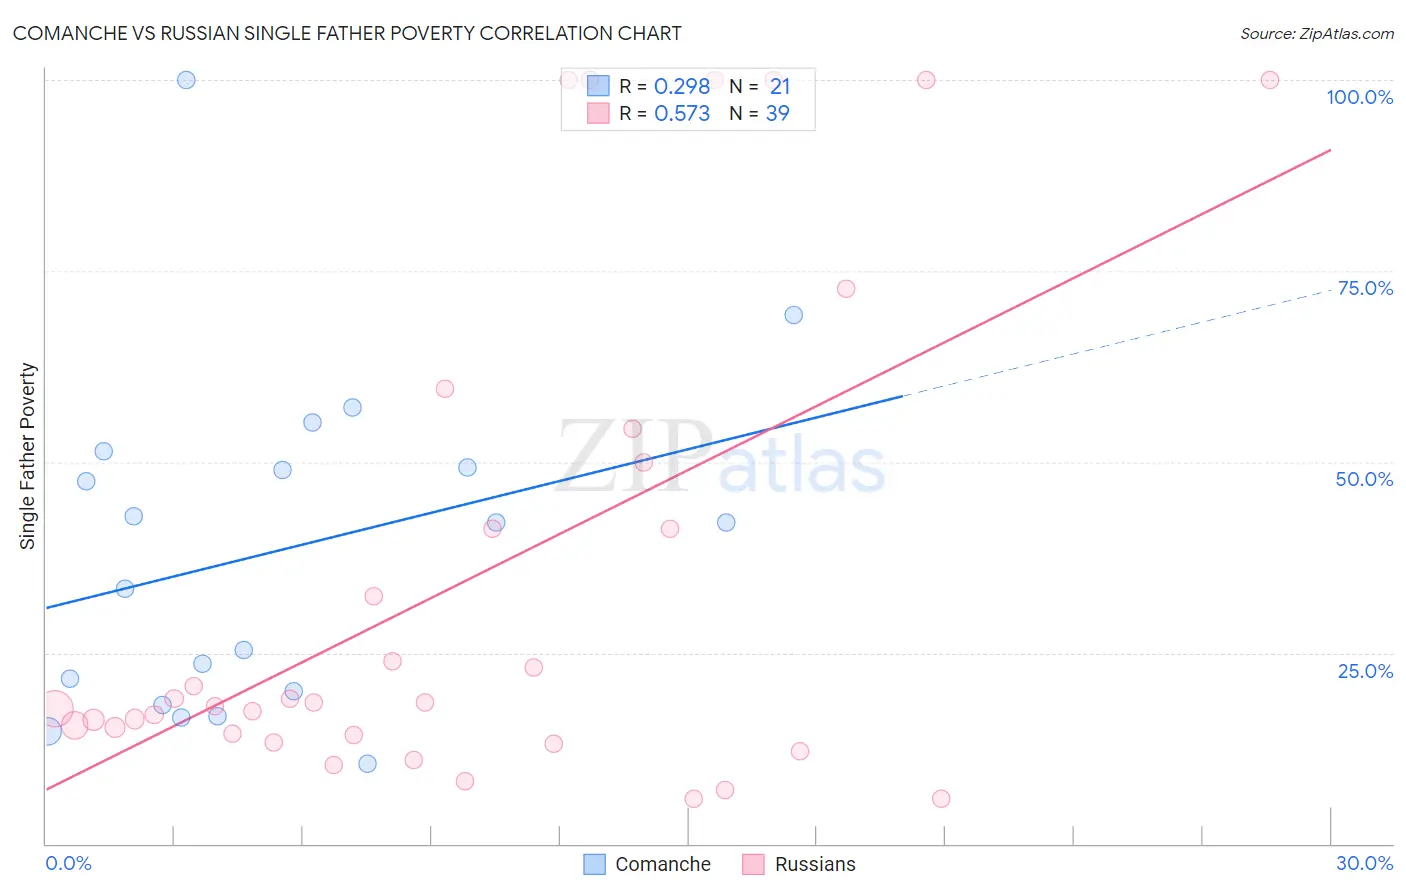
Comanche vs Russian Single Father Poverty Correlation Chart
The statistical analysis conducted on geographies consisting of 100,339,334 people shows a weak positive correlation between the proportion of Comanche and poverty level among single fathers in the United States with a correlation coefficient (R) of 0.298 and weighted average of 18.5%. Similarly, the statistical analysis conducted on geographies consisting of 378,661,966 people shows a substantial positive correlation between the proportion of Russians and poverty level among single fathers in the United States with a correlation coefficient (R) of 0.573 and weighted average of 16.4%, a difference of 12.3%.
Single Father Poverty Correlation Summary
| Measurement | Comanche | Russian |
| Minimum | 10.5% | 5.9% |
| Maximum | 100.0% | 100.0% |
| Range | 89.5% | 94.1% |
| Mean | 38.4% | 34.4% |
| Median | 42.1% | 18.4% |
| Interquartile 25% (IQ1) | 19.1% | 14.2% |
| Interquartile 75% (IQ3) | 50.3% | 50.0% |
| Interquartile Range (IQR) | 31.2% | 35.8% |
| Standard Deviation (Sample) | 21.9% | 32.0% |
| Standard Deviation (Population) | 21.4% | 31.6% |
Similar Demographics by Single Father Poverty
Demographics Similar to Comanche by Single Father Poverty
In terms of single father poverty, the demographic groups most similar to Comanche are Celtic (18.5%, a difference of 0.040%), Hungarian (18.5%, a difference of 0.11%), Ute (18.5%, a difference of 0.18%), Blackfeet (18.5%, a difference of 0.23%), and Immigrants from Dominican Republic (18.4%, a difference of 0.32%).
| Demographics | Rating | Rank | Single Father Poverty |
| Yakama | 0.0 /100 | #295 | Tragic 18.1% |
| Seminole | 0.0 /100 | #296 | Tragic 18.1% |
| French | 0.0 /100 | #297 | Tragic 18.2% |
| Africans | 0.0 /100 | #298 | Tragic 18.3% |
| Whites/Caucasians | 0.0 /100 | #299 | Tragic 18.4% |
| Immigrants | Dominican Republic | 0.0 /100 | #300 | Tragic 18.4% |
| Hungarians | 0.0 /100 | #301 | Tragic 18.5% |
| Comanche | 0.0 /100 | #302 | Tragic 18.5% |
| Celtics | 0.0 /100 | #303 | Tragic 18.5% |
| Ute | 0.0 /100 | #304 | Tragic 18.5% |
| Blackfeet | 0.0 /100 | #305 | Tragic 18.5% |
| Scotch-Irish | 0.0 /100 | #306 | Tragic 18.6% |
| French Canadians | 0.0 /100 | #307 | Tragic 18.6% |
| Ottawa | 0.0 /100 | #308 | Tragic 18.6% |
| Immigrants | Micronesia | 0.0 /100 | #309 | Tragic 18.6% |
Demographics Similar to Russians by Single Father Poverty
In terms of single father poverty, the demographic groups most similar to Russians are Ukrainian (16.4%, a difference of 0.020%), Immigrants from Venezuela (16.4%, a difference of 0.050%), Latvian (16.5%, a difference of 0.060%), Immigrants from Burma/Myanmar (16.5%, a difference of 0.11%), and Immigrants from Guyana (16.5%, a difference of 0.16%).
| Demographics | Rating | Rank | Single Father Poverty |
| Immigrants | Western Africa | 36.0 /100 | #181 | Fair 16.4% |
| Immigrants | Italy | 35.7 /100 | #182 | Fair 16.4% |
| Aleuts | 35.3 /100 | #183 | Fair 16.4% |
| Cambodians | 34.6 /100 | #184 | Fair 16.4% |
| Panamanians | 33.6 /100 | #185 | Fair 16.4% |
| Immigrants | Venezuela | 31.0 /100 | #186 | Fair 16.4% |
| Ukrainians | 30.4 /100 | #187 | Fair 16.4% |
| Russians | 30.1 /100 | #188 | Fair 16.4% |
| Latvians | 28.9 /100 | #189 | Fair 16.5% |
| Immigrants | Burma/Myanmar | 28.0 /100 | #190 | Fair 16.5% |
| Immigrants | Guyana | 27.1 /100 | #191 | Fair 16.5% |
| Immigrants | Switzerland | 24.8 /100 | #192 | Fair 16.5% |
| Ecuadorians | 24.5 /100 | #193 | Fair 16.5% |
| Cape Verdeans | 24.4 /100 | #194 | Fair 16.5% |
| Immigrants | Barbados | 24.3 /100 | #195 | Fair 16.5% |