Colombian vs Hopi Receiving Food Stamps
COMPARE
Colombian
Hopi
Receiving Food Stamps
Receiving Food Stamps Comparison
Colombians
Hopi
12.6%
RECEIVING FOOD STAMPS
10.2/ 100
METRIC RATING
211th/ 347
METRIC RANK
21.6%
RECEIVING FOOD STAMPS
0.0/ 100
METRIC RATING
341st/ 347
METRIC RANK
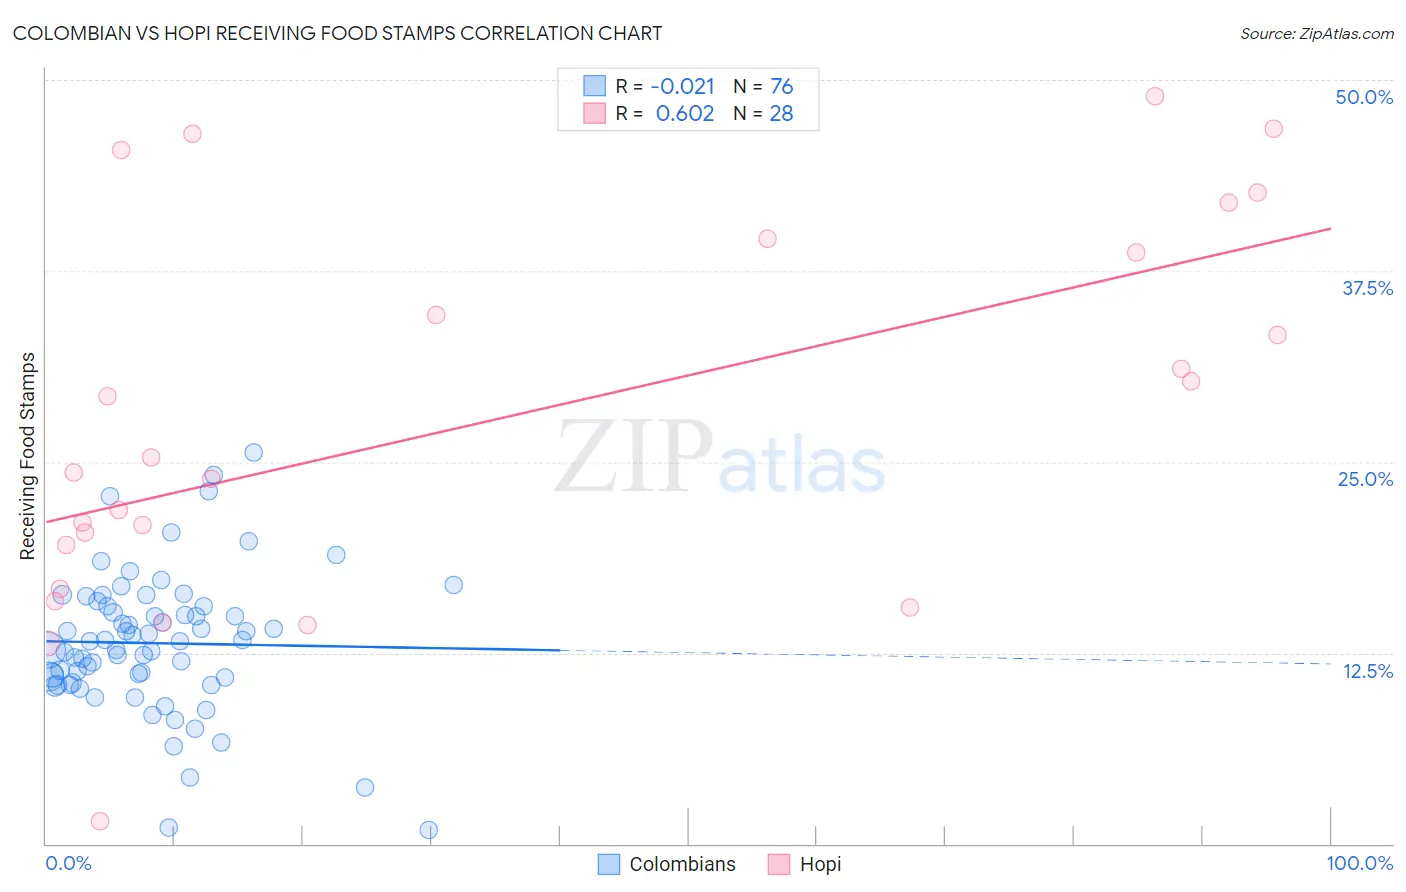
Colombian vs Hopi Receiving Food Stamps Correlation Chart
The statistical analysis conducted on geographies consisting of 418,206,966 people shows no correlation between the proportion of Colombians and percentage of population receiving government assistance and/or food stamps in the United States with a correlation coefficient (R) of -0.021 and weighted average of 12.6%. Similarly, the statistical analysis conducted on geographies consisting of 74,692,427 people shows a significant positive correlation between the proportion of Hopi and percentage of population receiving government assistance and/or food stamps in the United States with a correlation coefficient (R) of 0.602 and weighted average of 21.6%, a difference of 70.6%.
Receiving Food Stamps Correlation Summary
| Measurement | Colombian | Hopi |
| Minimum | 0.90% | 1.5% |
| Maximum | 25.6% | 48.9% |
| Range | 24.7% | 47.4% |
| Mean | 13.1% | 27.8% |
| Median | 13.3% | 24.8% |
| Interquartile 25% (IQ1) | 10.7% | 18.1% |
| Interquartile 75% (IQ3) | 15.5% | 39.1% |
| Interquartile Range (IQR) | 4.8% | 21.0% |
| Standard Deviation (Sample) | 4.6% | 12.5% |
| Standard Deviation (Population) | 4.5% | 12.3% |
Similar Demographics by Receiving Food Stamps
Demographics Similar to Colombians by Receiving Food Stamps
In terms of receiving food stamps, the demographic groups most similar to Colombians are Malaysian (12.7%, a difference of 0.63%), Immigrants from Uruguay (12.5%, a difference of 0.83%), Immigrants from Sierra Leone (12.5%, a difference of 0.86%), Moroccan (12.8%, a difference of 1.0%), and Immigrants from Africa (12.8%, a difference of 1.1%).
| Demographics | Rating | Rank | Receiving Food Stamps |
| Immigrants | Nonimmigrants | 17.6 /100 | #204 | Poor 12.4% |
| Aleuts | 17.3 /100 | #205 | Poor 12.4% |
| Immigrants | Thailand | 17.0 /100 | #206 | Poor 12.4% |
| South Americans | 16.0 /100 | #207 | Poor 12.4% |
| Potawatomi | 14.6 /100 | #208 | Poor 12.5% |
| Immigrants | Sierra Leone | 12.9 /100 | #209 | Poor 12.5% |
| Immigrants | Uruguay | 12.8 /100 | #210 | Poor 12.5% |
| Colombians | 10.2 /100 | #211 | Poor 12.6% |
| Malaysians | 8.5 /100 | #212 | Tragic 12.7% |
| Moroccans | 7.6 /100 | #213 | Tragic 12.8% |
| Immigrants | Africa | 7.6 /100 | #214 | Tragic 12.8% |
| Native Hawaiians | 6.7 /100 | #215 | Tragic 12.8% |
| Immigrants | South America | 6.5 /100 | #216 | Tragic 12.8% |
| Immigrants | Burma/Myanmar | 6.0 /100 | #217 | Tragic 12.9% |
| Hawaiians | 5.4 /100 | #218 | Tragic 12.9% |
Demographics Similar to Hopi by Receiving Food Stamps
In terms of receiving food stamps, the demographic groups most similar to Hopi are Tohono O'odham (21.5%, a difference of 0.37%), Immigrants from Yemen (21.6%, a difference of 0.41%), Yakama (21.4%, a difference of 0.63%), Dominican (21.4%, a difference of 0.89%), and Cape Verdean (21.1%, a difference of 2.3%).
| Demographics | Rating | Rank | Receiving Food Stamps |
| Inupiat | 0.0 /100 | #333 | Tragic 20.1% |
| Yuman | 0.0 /100 | #334 | Tragic 20.2% |
| Immigrants | Cuba | 0.0 /100 | #335 | Tragic 20.8% |
| Navajo | 0.0 /100 | #336 | Tragic 21.1% |
| Cape Verdeans | 0.0 /100 | #337 | Tragic 21.1% |
| Dominicans | 0.0 /100 | #338 | Tragic 21.4% |
| Yakama | 0.0 /100 | #339 | Tragic 21.4% |
| Tohono O'odham | 0.0 /100 | #340 | Tragic 21.5% |
| Hopi | 0.0 /100 | #341 | Tragic 21.6% |
| Immigrants | Yemen | 0.0 /100 | #342 | Tragic 21.6% |
| Immigrants | Dominican Republic | 0.0 /100 | #343 | Tragic 22.1% |
| Lumbee | 0.0 /100 | #344 | Tragic 22.9% |
| Immigrants | Cabo Verde | 0.0 /100 | #345 | Tragic 23.8% |
| Puerto Ricans | 0.0 /100 | #346 | Tragic 26.0% |
| Yup'ik | 0.0 /100 | #347 | Tragic 32.7% |