Colombian vs Immigrants from Taiwan Single Male Poverty
COMPARE
Colombian
Immigrants from Taiwan
Single Male Poverty
Single Male Poverty Comparison
Colombians
Immigrants from Taiwan
12.2%
SINGLE MALE POVERTY
97.8/ 100
METRIC RATING
94th/ 347
METRIC RANK
10.3%
SINGLE MALE POVERTY
100.0/ 100
METRIC RATING
2nd/ 347
METRIC RANK
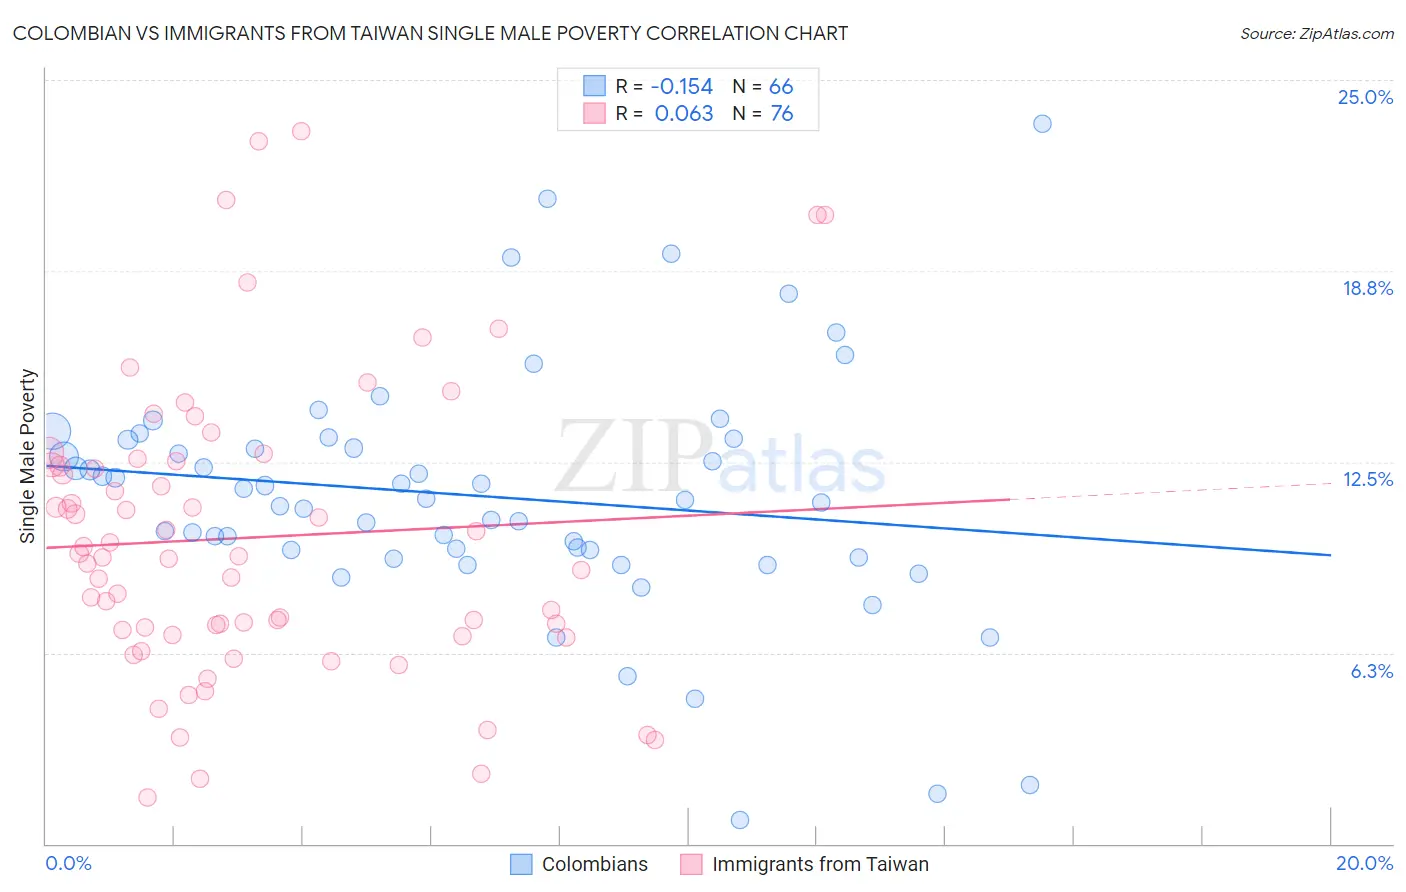
Colombian vs Immigrants from Taiwan Single Male Poverty Correlation Chart
The statistical analysis conducted on geographies consisting of 370,615,335 people shows a poor negative correlation between the proportion of Colombians and poverty level among single males in the United States with a correlation coefficient (R) of -0.154 and weighted average of 12.2%. Similarly, the statistical analysis conducted on geographies consisting of 266,940,176 people shows a slight positive correlation between the proportion of Immigrants from Taiwan and poverty level among single males in the United States with a correlation coefficient (R) of 0.063 and weighted average of 10.3%, a difference of 18.3%.
Single Male Poverty Correlation Summary
| Measurement | Colombian | Immigrants from Taiwan |
| Minimum | 0.77% | 1.5% |
| Maximum | 23.6% | 23.3% |
| Range | 22.8% | 21.8% |
| Mean | 11.4% | 10.0% |
| Median | 11.3% | 9.4% |
| Interquartile 25% (IQ1) | 9.6% | 6.9% |
| Interquartile 75% (IQ3) | 13.2% | 12.5% |
| Interquartile Range (IQR) | 3.6% | 5.5% |
| Standard Deviation (Sample) | 4.0% | 4.8% |
| Standard Deviation (Population) | 4.0% | 4.8% |
Similar Demographics by Single Male Poverty
Demographics Similar to Colombians by Single Male Poverty
In terms of single male poverty, the demographic groups most similar to Colombians are Mongolian (12.2%, a difference of 0.010%), Immigrants from Bosnia and Herzegovina (12.1%, a difference of 0.12%), Immigrants from Sweden (12.2%, a difference of 0.16%), Spanish American Indian (12.1%, a difference of 0.18%), and Immigrants from Italy (12.2%, a difference of 0.21%).
| Demographics | Rating | Rank | Single Male Poverty |
| South Americans | 98.5 /100 | #87 | Exceptional 12.1% |
| Immigrants | Eritrea | 98.5 /100 | #88 | Exceptional 12.1% |
| Immigrants | Ireland | 98.3 /100 | #89 | Exceptional 12.1% |
| South American Indians | 98.3 /100 | #90 | Exceptional 12.1% |
| Immigrants | Turkey | 98.2 /100 | #91 | Exceptional 12.1% |
| Spanish American Indians | 98.0 /100 | #92 | Exceptional 12.1% |
| Immigrants | Bosnia and Herzegovina | 97.9 /100 | #93 | Exceptional 12.1% |
| Colombians | 97.8 /100 | #94 | Exceptional 12.2% |
| Mongolians | 97.7 /100 | #95 | Exceptional 12.2% |
| Immigrants | Sweden | 97.5 /100 | #96 | Exceptional 12.2% |
| Immigrants | Italy | 97.4 /100 | #97 | Exceptional 12.2% |
| Guamanians/Chamorros | 97.4 /100 | #98 | Exceptional 12.2% |
| Immigrants | Cuba | 97.3 /100 | #99 | Exceptional 12.2% |
| Immigrants | Australia | 97.1 /100 | #100 | Exceptional 12.2% |
| Immigrants | Latvia | 97.0 /100 | #101 | Exceptional 12.2% |
Demographics Similar to Immigrants from Taiwan by Single Male Poverty
In terms of single male poverty, the demographic groups most similar to Immigrants from Taiwan are Immigrants from India (10.3%, a difference of 0.67%), Immigrants from Hong Kong (10.4%, a difference of 1.7%), Tongan (10.5%, a difference of 1.7%), Filipino (10.6%, a difference of 3.4%), and Afghan (10.7%, a difference of 4.2%).
| Demographics | Rating | Rank | Single Male Poverty |
| Assyrians/Chaldeans/Syriacs | 100.0 /100 | #1 | Exceptional 9.8% |
| Immigrants | Taiwan | 100.0 /100 | #2 | Exceptional 10.3% |
| Immigrants | India | 100.0 /100 | #3 | Exceptional 10.3% |
| Immigrants | Hong Kong | 100.0 /100 | #4 | Exceptional 10.4% |
| Tongans | 100.0 /100 | #5 | Exceptional 10.5% |
| Filipinos | 100.0 /100 | #6 | Exceptional 10.6% |
| Afghans | 100.0 /100 | #7 | Exceptional 10.7% |
| Thais | 100.0 /100 | #8 | Exceptional 10.8% |
| Taiwanese | 100.0 /100 | #9 | Exceptional 10.9% |
| Immigrants | Fiji | 100.0 /100 | #10 | Exceptional 10.9% |
| Immigrants | Philippines | 100.0 /100 | #11 | Exceptional 10.9% |
| Immigrants | Afghanistan | 100.0 /100 | #12 | Exceptional 10.9% |
| Immigrants | South Central Asia | 100.0 /100 | #13 | Exceptional 10.9% |
| Chinese | 100.0 /100 | #14 | Exceptional 11.0% |
| Koreans | 100.0 /100 | #15 | Exceptional 11.0% |