Colombian vs Eastern European Single Male Poverty
COMPARE
Colombian
Eastern European
Single Male Poverty
Single Male Poverty Comparison
Colombians
Eastern Europeans
12.2%
SINGLE MALE POVERTY
97.8/ 100
METRIC RATING
94th/ 347
METRIC RANK
12.7%
SINGLE MALE POVERTY
63.3/ 100
METRIC RATING
162nd/ 347
METRIC RANK
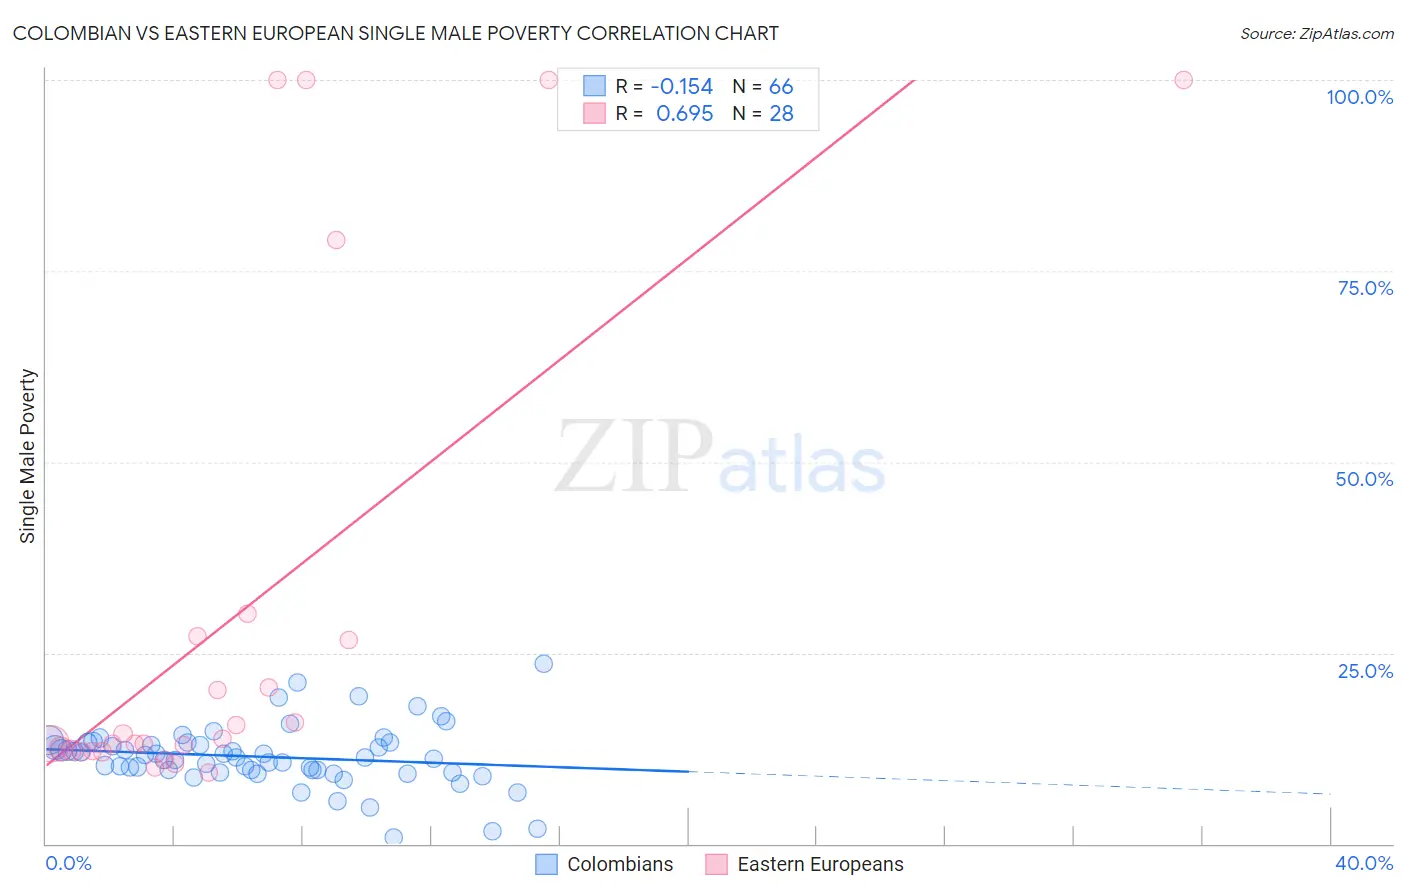
Colombian vs Eastern European Single Male Poverty Correlation Chart
The statistical analysis conducted on geographies consisting of 370,615,335 people shows a poor negative correlation between the proportion of Colombians and poverty level among single males in the United States with a correlation coefficient (R) of -0.154 and weighted average of 12.2%. Similarly, the statistical analysis conducted on geographies consisting of 394,365,623 people shows a significant positive correlation between the proportion of Eastern Europeans and poverty level among single males in the United States with a correlation coefficient (R) of 0.695 and weighted average of 12.7%, a difference of 4.5%.
Single Male Poverty Correlation Summary
| Measurement | Colombian | Eastern European |
| Minimum | 0.77% | 9.4% |
| Maximum | 23.6% | 100.0% |
| Range | 22.8% | 90.6% |
| Mean | 11.4% | 29.6% |
| Median | 11.3% | 13.5% |
| Interquartile 25% (IQ1) | 9.6% | 12.2% |
| Interquartile 75% (IQ3) | 13.2% | 26.9% |
| Interquartile Range (IQR) | 3.6% | 14.7% |
| Standard Deviation (Sample) | 4.0% | 32.0% |
| Standard Deviation (Population) | 4.0% | 31.5% |
Similar Demographics by Single Male Poverty
Demographics Similar to Colombians by Single Male Poverty
In terms of single male poverty, the demographic groups most similar to Colombians are Mongolian (12.2%, a difference of 0.010%), Immigrants from Bosnia and Herzegovina (12.1%, a difference of 0.12%), Immigrants from Sweden (12.2%, a difference of 0.16%), Spanish American Indian (12.1%, a difference of 0.18%), and Immigrants from Italy (12.2%, a difference of 0.21%).
| Demographics | Rating | Rank | Single Male Poverty |
| South Americans | 98.5 /100 | #87 | Exceptional 12.1% |
| Immigrants | Eritrea | 98.5 /100 | #88 | Exceptional 12.1% |
| Immigrants | Ireland | 98.3 /100 | #89 | Exceptional 12.1% |
| South American Indians | 98.3 /100 | #90 | Exceptional 12.1% |
| Immigrants | Turkey | 98.2 /100 | #91 | Exceptional 12.1% |
| Spanish American Indians | 98.0 /100 | #92 | Exceptional 12.1% |
| Immigrants | Bosnia and Herzegovina | 97.9 /100 | #93 | Exceptional 12.1% |
| Colombians | 97.8 /100 | #94 | Exceptional 12.2% |
| Mongolians | 97.7 /100 | #95 | Exceptional 12.2% |
| Immigrants | Sweden | 97.5 /100 | #96 | Exceptional 12.2% |
| Immigrants | Italy | 97.4 /100 | #97 | Exceptional 12.2% |
| Guamanians/Chamorros | 97.4 /100 | #98 | Exceptional 12.2% |
| Immigrants | Cuba | 97.3 /100 | #99 | Exceptional 12.2% |
| Immigrants | Australia | 97.1 /100 | #100 | Exceptional 12.2% |
| Immigrants | Latvia | 97.0 /100 | #101 | Exceptional 12.2% |
Demographics Similar to Eastern Europeans by Single Male Poverty
In terms of single male poverty, the demographic groups most similar to Eastern Europeans are Immigrants from Africa (12.7%, a difference of 0.010%), Palestinian (12.7%, a difference of 0.010%), Immigrants from Nigeria (12.7%, a difference of 0.020%), Immigrants from Liberia (12.7%, a difference of 0.050%), and Greek (12.7%, a difference of 0.050%).
| Demographics | Rating | Rank | Single Male Poverty |
| Immigrants | Spain | 68.7 /100 | #155 | Good 12.7% |
| Vietnamese | 67.9 /100 | #156 | Good 12.7% |
| Latvians | 67.9 /100 | #157 | Good 12.7% |
| Immigrants | Middle Africa | 64.9 /100 | #158 | Good 12.7% |
| Immigrants | Liberia | 64.2 /100 | #159 | Good 12.7% |
| Greeks | 64.1 /100 | #160 | Good 12.7% |
| Immigrants | Africa | 63.4 /100 | #161 | Good 12.7% |
| Eastern Europeans | 63.3 /100 | #162 | Good 12.7% |
| Palestinians | 63.1 /100 | #163 | Good 12.7% |
| Immigrants | Nigeria | 62.8 /100 | #164 | Good 12.7% |
| Immigrants | Cambodia | 62.2 /100 | #165 | Good 12.7% |
| Immigrants | Guyana | 60.5 /100 | #166 | Good 12.7% |
| Immigrants | Sudan | 58.2 /100 | #167 | Average 12.7% |
| Immigrants | Barbados | 57.7 /100 | #168 | Average 12.7% |
| Puget Sound Salish | 54.3 /100 | #169 | Average 12.8% |