Colombian vs Immigrants from Bulgaria Single Male Poverty
COMPARE
Colombian
Immigrants from Bulgaria
Single Male Poverty
Single Male Poverty Comparison
Colombians
Immigrants from Bulgaria
12.2%
SINGLE MALE POVERTY
97.8/ 100
METRIC RATING
94th/ 347
METRIC RANK
11.6%
SINGLE MALE POVERTY
99.9/ 100
METRIC RATING
46th/ 347
METRIC RANK
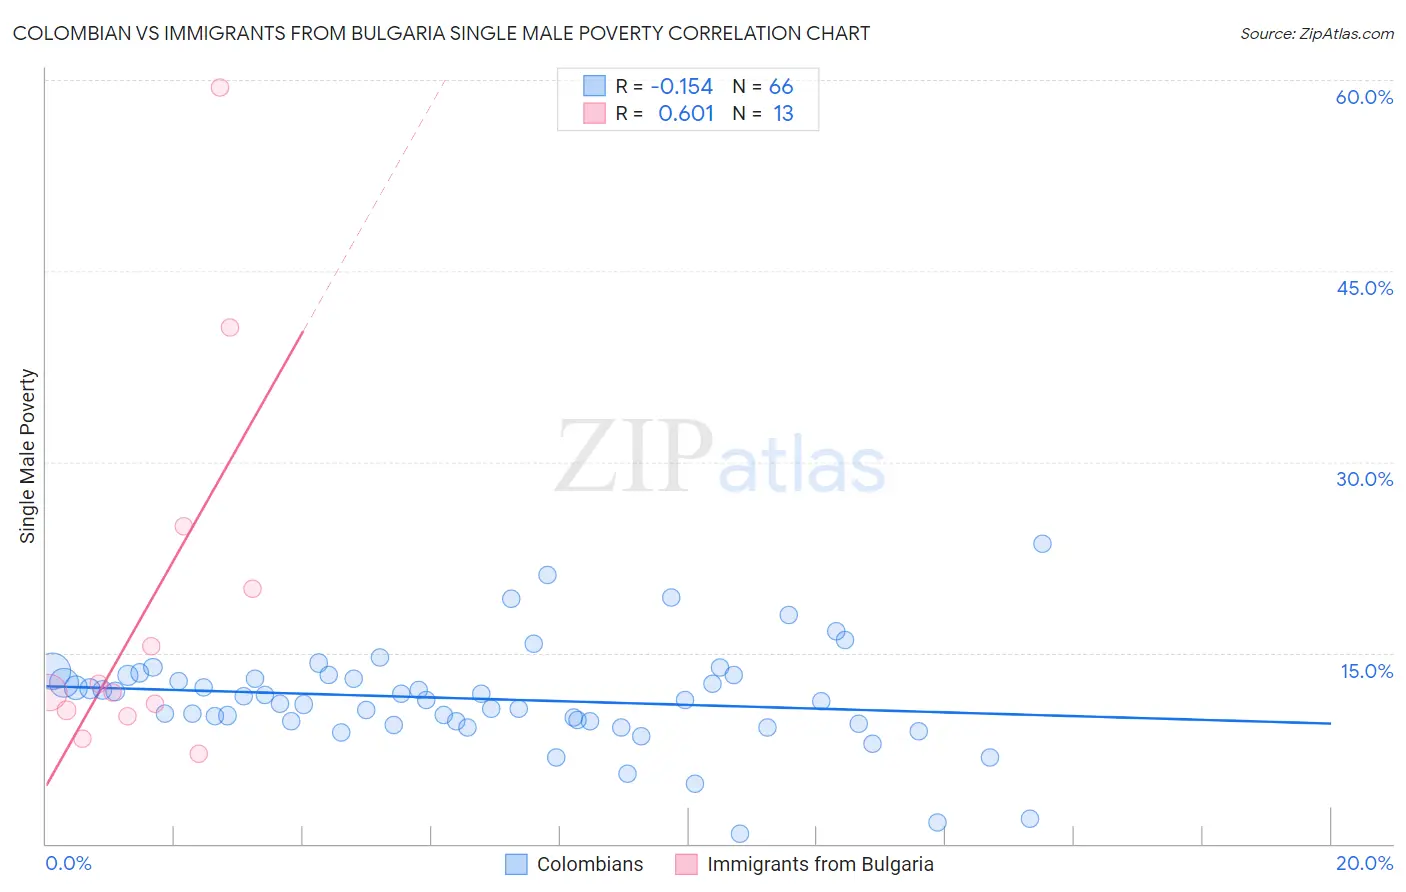
Colombian vs Immigrants from Bulgaria Single Male Poverty Correlation Chart
The statistical analysis conducted on geographies consisting of 370,615,335 people shows a poor negative correlation between the proportion of Colombians and poverty level among single males in the United States with a correlation coefficient (R) of -0.154 and weighted average of 12.2%. Similarly, the statistical analysis conducted on geographies consisting of 159,455,657 people shows a significant positive correlation between the proportion of Immigrants from Bulgaria and poverty level among single males in the United States with a correlation coefficient (R) of 0.601 and weighted average of 11.6%, a difference of 5.2%.
Single Male Poverty Correlation Summary
| Measurement | Colombian | Immigrants from Bulgaria |
| Minimum | 0.77% | 7.0% |
| Maximum | 23.6% | 59.4% |
| Range | 22.8% | 52.3% |
| Mean | 11.4% | 18.7% |
| Median | 11.3% | 11.9% |
| Interquartile 25% (IQ1) | 9.6% | 10.3% |
| Interquartile 75% (IQ3) | 13.2% | 22.5% |
| Interquartile Range (IQR) | 3.6% | 12.2% |
| Standard Deviation (Sample) | 4.0% | 15.2% |
| Standard Deviation (Population) | 4.0% | 14.6% |
Similar Demographics by Single Male Poverty
Demographics Similar to Colombians by Single Male Poverty
In terms of single male poverty, the demographic groups most similar to Colombians are Mongolian (12.2%, a difference of 0.010%), Immigrants from Bosnia and Herzegovina (12.1%, a difference of 0.12%), Immigrants from Sweden (12.2%, a difference of 0.16%), Spanish American Indian (12.1%, a difference of 0.18%), and Immigrants from Italy (12.2%, a difference of 0.21%).
| Demographics | Rating | Rank | Single Male Poverty |
| South Americans | 98.5 /100 | #87 | Exceptional 12.1% |
| Immigrants | Eritrea | 98.5 /100 | #88 | Exceptional 12.1% |
| Immigrants | Ireland | 98.3 /100 | #89 | Exceptional 12.1% |
| South American Indians | 98.3 /100 | #90 | Exceptional 12.1% |
| Immigrants | Turkey | 98.2 /100 | #91 | Exceptional 12.1% |
| Spanish American Indians | 98.0 /100 | #92 | Exceptional 12.1% |
| Immigrants | Bosnia and Herzegovina | 97.9 /100 | #93 | Exceptional 12.1% |
| Colombians | 97.8 /100 | #94 | Exceptional 12.2% |
| Mongolians | 97.7 /100 | #95 | Exceptional 12.2% |
| Immigrants | Sweden | 97.5 /100 | #96 | Exceptional 12.2% |
| Immigrants | Italy | 97.4 /100 | #97 | Exceptional 12.2% |
| Guamanians/Chamorros | 97.4 /100 | #98 | Exceptional 12.2% |
| Immigrants | Cuba | 97.3 /100 | #99 | Exceptional 12.2% |
| Immigrants | Australia | 97.1 /100 | #100 | Exceptional 12.2% |
| Immigrants | Latvia | 97.0 /100 | #101 | Exceptional 12.2% |
Demographics Similar to Immigrants from Bulgaria by Single Male Poverty
In terms of single male poverty, the demographic groups most similar to Immigrants from Bulgaria are Immigrants from Poland (11.5%, a difference of 0.13%), Immigrants from Cameroon (11.5%, a difference of 0.15%), Immigrants from Peru (11.5%, a difference of 0.16%), Nepalese (11.6%, a difference of 0.20%), and Immigrants from Indonesia (11.6%, a difference of 0.27%).
| Demographics | Rating | Rank | Single Male Poverty |
| Soviet Union | 100.0 /100 | #39 | Exceptional 11.5% |
| Immigrants | Korea | 100.0 /100 | #40 | Exceptional 11.5% |
| Immigrants | Iraq | 99.9 /100 | #41 | Exceptional 11.5% |
| Egyptians | 99.9 /100 | #42 | Exceptional 11.5% |
| Immigrants | Peru | 99.9 /100 | #43 | Exceptional 11.5% |
| Immigrants | Cameroon | 99.9 /100 | #44 | Exceptional 11.5% |
| Immigrants | Poland | 99.9 /100 | #45 | Exceptional 11.5% |
| Immigrants | Bulgaria | 99.9 /100 | #46 | Exceptional 11.6% |
| Nepalese | 99.9 /100 | #47 | Exceptional 11.6% |
| Immigrants | Indonesia | 99.9 /100 | #48 | Exceptional 11.6% |
| Tlingit-Haida | 99.9 /100 | #49 | Exceptional 11.6% |
| Immigrants | Lithuania | 99.9 /100 | #50 | Exceptional 11.6% |
| Paraguayans | 99.9 /100 | #51 | Exceptional 11.6% |
| Samoans | 99.9 /100 | #52 | Exceptional 11.7% |
| Bulgarians | 99.9 /100 | #53 | Exceptional 11.7% |