American vs Immigrants from Taiwan Single Male Poverty
COMPARE
American
Immigrants from Taiwan
Single Male Poverty
Single Male Poverty Comparison
Americans
Immigrants from Taiwan
15.8%
SINGLE MALE POVERTY
0.0/ 100
METRIC RATING
309th/ 347
METRIC RANK
10.3%
SINGLE MALE POVERTY
100.0/ 100
METRIC RATING
2nd/ 347
METRIC RANK
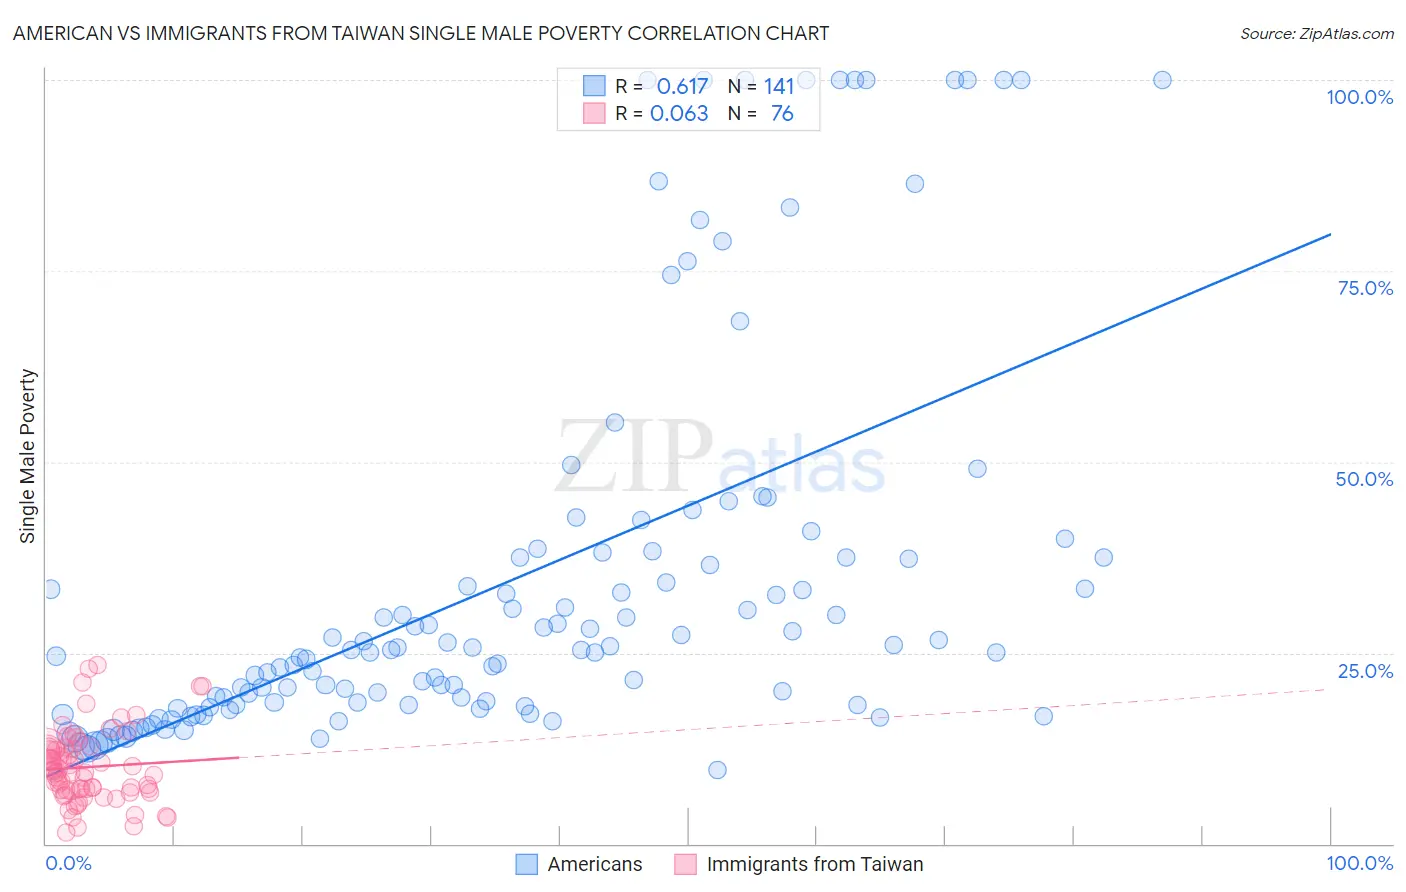
American vs Immigrants from Taiwan Single Male Poverty Correlation Chart
The statistical analysis conducted on geographies consisting of 478,139,646 people shows a significant positive correlation between the proportion of Americans and poverty level among single males in the United States with a correlation coefficient (R) of 0.617 and weighted average of 15.8%. Similarly, the statistical analysis conducted on geographies consisting of 266,940,176 people shows a slight positive correlation between the proportion of Immigrants from Taiwan and poverty level among single males in the United States with a correlation coefficient (R) of 0.063 and weighted average of 10.3%, a difference of 53.7%.
Single Male Poverty Correlation Summary
| Measurement | American | Immigrants from Taiwan |
| Minimum | 9.7% | 1.5% |
| Maximum | 100.0% | 23.3% |
| Range | 90.3% | 21.8% |
| Mean | 34.5% | 10.0% |
| Median | 25.4% | 9.4% |
| Interquartile 25% (IQ1) | 18.2% | 6.9% |
| Interquartile 75% (IQ3) | 37.5% | 12.5% |
| Interquartile Range (IQR) | 19.3% | 5.5% |
| Standard Deviation (Sample) | 25.3% | 4.8% |
| Standard Deviation (Population) | 25.2% | 4.8% |
Similar Demographics by Single Male Poverty
Demographics Similar to Americans by Single Male Poverty
In terms of single male poverty, the demographic groups most similar to Americans are Potawatomi (15.8%, a difference of 0.17%), Ute (15.7%, a difference of 0.73%), Yakama (15.9%, a difference of 0.87%), Seminole (16.0%, a difference of 1.4%), and Comanche (16.0%, a difference of 1.4%).
| Demographics | Rating | Rank | Single Male Poverty |
| Alsatians | 0.0 /100 | #302 | Tragic 15.2% |
| Aleuts | 0.0 /100 | #303 | Tragic 15.4% |
| Alaska Natives | 0.0 /100 | #304 | Tragic 15.4% |
| Blackfeet | 0.0 /100 | #305 | Tragic 15.5% |
| Pennsylvania Germans | 0.0 /100 | #306 | Tragic 15.6% |
| Ute | 0.0 /100 | #307 | Tragic 15.7% |
| Potawatomi | 0.0 /100 | #308 | Tragic 15.8% |
| Americans | 0.0 /100 | #309 | Tragic 15.8% |
| Yakama | 0.0 /100 | #310 | Tragic 15.9% |
| Seminole | 0.0 /100 | #311 | Tragic 16.0% |
| Comanche | 0.0 /100 | #312 | Tragic 16.0% |
| Cherokee | 0.0 /100 | #313 | Tragic 16.1% |
| Alaskan Athabascans | 0.0 /100 | #314 | Tragic 16.1% |
| Cheyenne | 0.0 /100 | #315 | Tragic 16.1% |
| Dutch West Indians | 0.0 /100 | #316 | Tragic 16.1% |
Demographics Similar to Immigrants from Taiwan by Single Male Poverty
In terms of single male poverty, the demographic groups most similar to Immigrants from Taiwan are Immigrants from India (10.3%, a difference of 0.67%), Immigrants from Hong Kong (10.4%, a difference of 1.7%), Tongan (10.5%, a difference of 1.7%), Filipino (10.6%, a difference of 3.4%), and Afghan (10.7%, a difference of 4.2%).
| Demographics | Rating | Rank | Single Male Poverty |
| Assyrians/Chaldeans/Syriacs | 100.0 /100 | #1 | Exceptional 9.8% |
| Immigrants | Taiwan | 100.0 /100 | #2 | Exceptional 10.3% |
| Immigrants | India | 100.0 /100 | #3 | Exceptional 10.3% |
| Immigrants | Hong Kong | 100.0 /100 | #4 | Exceptional 10.4% |
| Tongans | 100.0 /100 | #5 | Exceptional 10.5% |
| Filipinos | 100.0 /100 | #6 | Exceptional 10.6% |
| Afghans | 100.0 /100 | #7 | Exceptional 10.7% |
| Thais | 100.0 /100 | #8 | Exceptional 10.8% |
| Taiwanese | 100.0 /100 | #9 | Exceptional 10.9% |
| Immigrants | Fiji | 100.0 /100 | #10 | Exceptional 10.9% |
| Immigrants | Philippines | 100.0 /100 | #11 | Exceptional 10.9% |
| Immigrants | Afghanistan | 100.0 /100 | #12 | Exceptional 10.9% |
| Immigrants | South Central Asia | 100.0 /100 | #13 | Exceptional 10.9% |
| Chinese | 100.0 /100 | #14 | Exceptional 11.0% |
| Koreans | 100.0 /100 | #15 | Exceptional 11.0% |