Colombian vs Immigrants from Taiwan Householder Income Ages 25 - 44 years
COMPARE
Colombian
Immigrants from Taiwan
Householder Income Ages 25 - 44 years
Householder Income Ages 25 - 44 years Comparison
Colombians
Immigrants from Taiwan
$94,565
HOUSEHOLDER INCOME AGES 25 - 44 YEARS
50.0/ 100
METRIC RATING
174th/ 347
METRIC RANK
$129,122
HOUSEHOLDER INCOME AGES 25 - 44 YEARS
100.0/ 100
METRIC RATING
1st/ 347
METRIC RANK
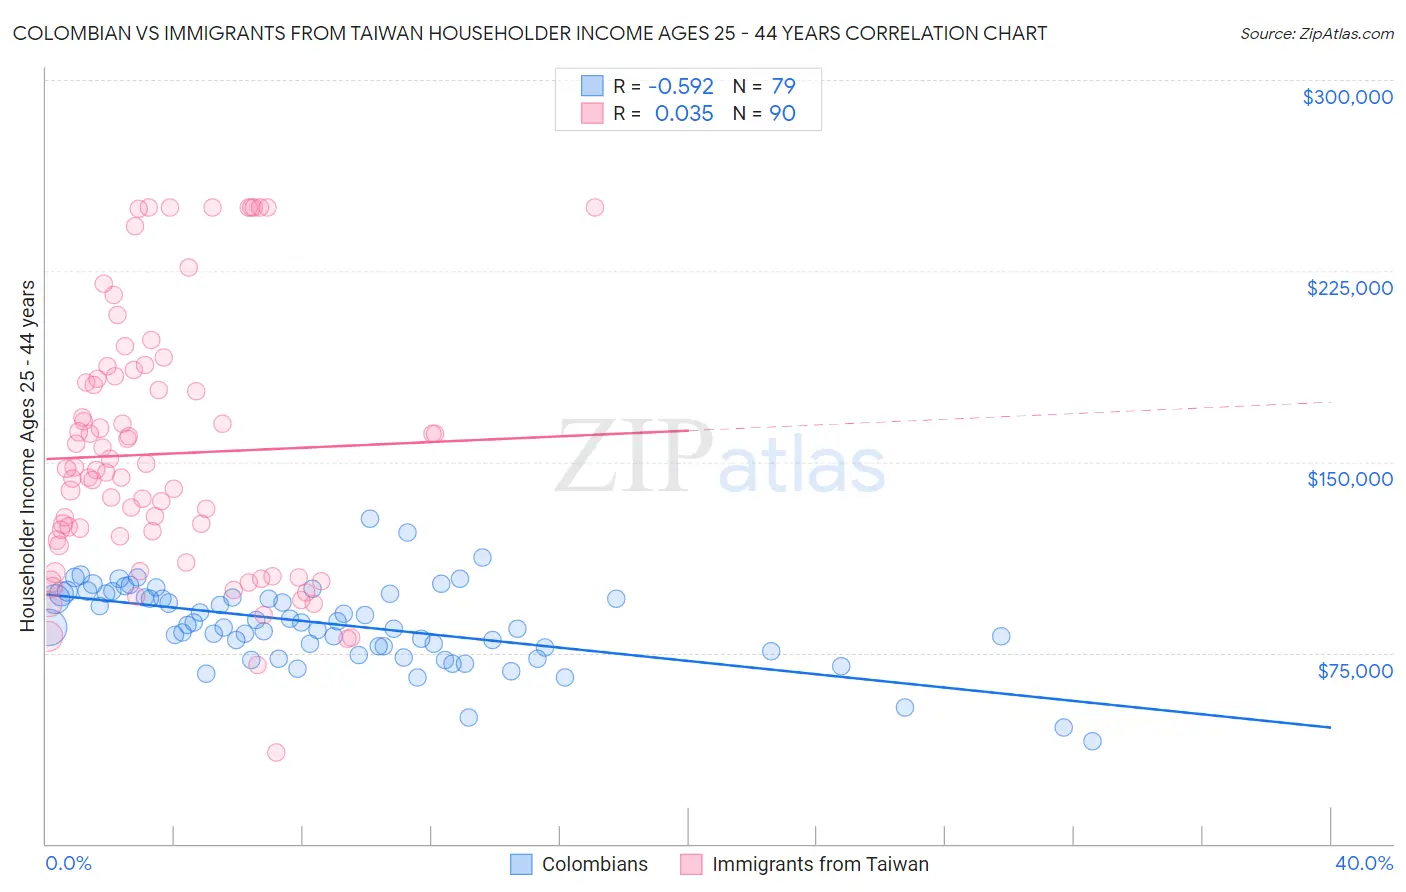
Colombian vs Immigrants from Taiwan Householder Income Ages 25 - 44 years Correlation Chart
The statistical analysis conducted on geographies consisting of 418,592,310 people shows a substantial negative correlation between the proportion of Colombians and household income with householder between the ages 25 and 44 in the United States with a correlation coefficient (R) of -0.592 and weighted average of $94,565. Similarly, the statistical analysis conducted on geographies consisting of 297,780,144 people shows no correlation between the proportion of Immigrants from Taiwan and household income with householder between the ages 25 and 44 in the United States with a correlation coefficient (R) of 0.035 and weighted average of $129,122, a difference of 36.5%.
Householder Income Ages 25 - 44 years Correlation Summary
| Measurement | Colombian | Immigrants from Taiwan |
| Minimum | $40,446 | $35,653 |
| Maximum | $127,452 | $250,001 |
| Range | $87,006 | $214,348 |
| Mean | $86,168 | $153,134 |
| Median | $85,799 | $146,407 |
| Interquartile 25% (IQ1) | $77,037 | $117,158 |
| Interquartile 75% (IQ3) | $98,109 | $182,503 |
| Interquartile Range (IQR) | $21,072 | $65,344 |
| Standard Deviation (Sample) | $15,709 | $50,634 |
| Standard Deviation (Population) | $15,610 | $50,352 |
Similar Demographics by Householder Income Ages 25 - 44 years
Demographics Similar to Colombians by Householder Income Ages 25 - 44 years
In terms of householder income ages 25 - 44 years, the demographic groups most similar to Colombians are Finnish ($94,610, a difference of 0.050%), Scottish ($94,622, a difference of 0.060%), English ($94,429, a difference of 0.14%), Immigrants ($94,423, a difference of 0.15%), and Immigrants from Armenia ($94,867, a difference of 0.32%).
| Demographics | Rating | Rank | Householder Income Ages 25 - 44 years |
| Czechoslovakians | 57.0 /100 | #167 | Average $95,070 |
| Alsatians | 56.8 /100 | #168 | Average $95,059 |
| Native Hawaiians | 56.8 /100 | #169 | Average $95,058 |
| Slovaks | 56.4 /100 | #170 | Average $95,032 |
| Immigrants | Armenia | 54.2 /100 | #171 | Average $94,867 |
| Scottish | 50.8 /100 | #172 | Average $94,622 |
| Finns | 50.6 /100 | #173 | Average $94,610 |
| Colombians | 50.0 /100 | #174 | Average $94,565 |
| English | 48.1 /100 | #175 | Average $94,429 |
| Immigrants | Immigrants | 48.0 /100 | #176 | Average $94,423 |
| Belgians | 45.8 /100 | #177 | Average $94,262 |
| Immigrants | South America | 42.8 /100 | #178 | Average $94,042 |
| French Canadians | 38.2 /100 | #179 | Fair $93,694 |
| French | 37.8 /100 | #180 | Fair $93,665 |
| Puget Sound Salish | 37.7 /100 | #181 | Fair $93,661 |
Demographics Similar to Immigrants from Taiwan by Householder Income Ages 25 - 44 years
In terms of householder income ages 25 - 44 years, the demographic groups most similar to Immigrants from Taiwan are Filipino ($128,723, a difference of 0.31%), Immigrants from Hong Kong ($128,140, a difference of 0.77%), Immigrants from Singapore ($124,429, a difference of 3.8%), Immigrants from India ($124,238, a difference of 3.9%), and Thai ($121,778, a difference of 6.0%).
| Demographics | Rating | Rank | Householder Income Ages 25 - 44 years |
| Immigrants | Taiwan | 100.0 /100 | #1 | Exceptional $129,122 |
| Filipinos | 100.0 /100 | #2 | Exceptional $128,723 |
| Immigrants | Hong Kong | 100.0 /100 | #3 | Exceptional $128,140 |
| Immigrants | Singapore | 100.0 /100 | #4 | Exceptional $124,429 |
| Immigrants | India | 100.0 /100 | #5 | Exceptional $124,238 |
| Thais | 100.0 /100 | #6 | Exceptional $121,778 |
| Immigrants | Ireland | 100.0 /100 | #7 | Exceptional $120,333 |
| Iranians | 100.0 /100 | #8 | Exceptional $120,292 |
| Immigrants | China | 100.0 /100 | #9 | Exceptional $119,756 |
| Indians (Asian) | 100.0 /100 | #10 | Exceptional $119,496 |
| Okinawans | 100.0 /100 | #11 | Exceptional $119,349 |
| Immigrants | Iran | 100.0 /100 | #12 | Exceptional $119,204 |
| Immigrants | Eastern Asia | 100.0 /100 | #13 | Exceptional $118,056 |
| Immigrants | Israel | 100.0 /100 | #14 | Exceptional $117,219 |
| Immigrants | South Central Asia | 100.0 /100 | #15 | Exceptional $116,626 |