Colombian vs Immigrants from Taiwan Child Poverty Under the Age of 16
COMPARE
Colombian
Immigrants from Taiwan
Child Poverty Under the Age of 16
Child Poverty Under the Age of 16 Comparison
Colombians
Immigrants from Taiwan
15.8%
CHILD POVERTY UNDER THE AGE OF 16
67.6/ 100
METRIC RATING
162nd/ 347
METRIC RANK
11.0%
CHILD POVERTY UNDER THE AGE OF 16
100.0/ 100
METRIC RATING
2nd/ 347
METRIC RANK
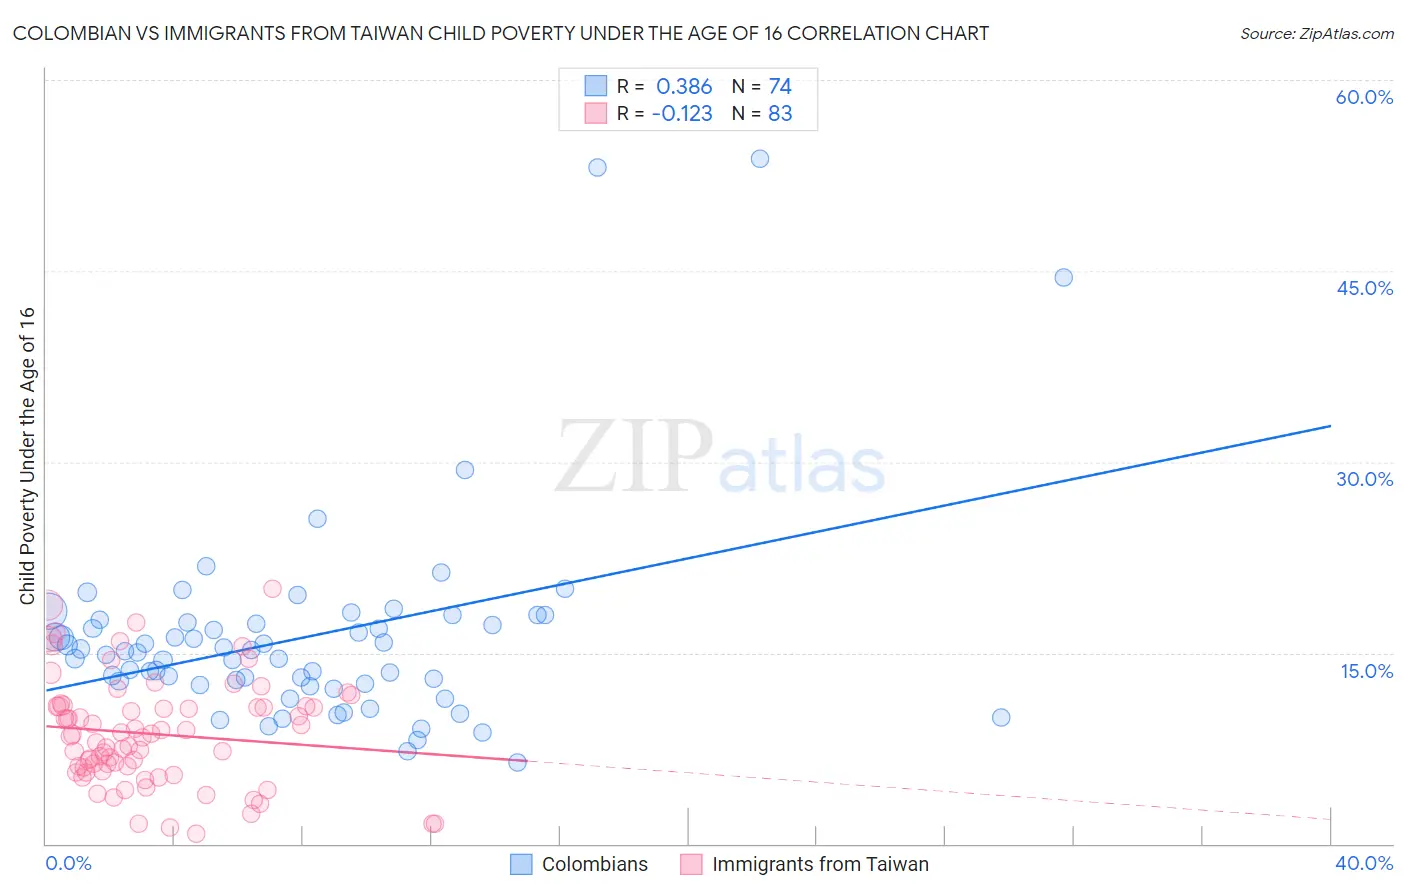
Colombian vs Immigrants from Taiwan Child Poverty Under the Age of 16 Correlation Chart
The statistical analysis conducted on geographies consisting of 415,703,397 people shows a mild positive correlation between the proportion of Colombians and poverty level among children under the age of 16 in the United States with a correlation coefficient (R) of 0.386 and weighted average of 15.8%. Similarly, the statistical analysis conducted on geographies consisting of 295,758,075 people shows a poor negative correlation between the proportion of Immigrants from Taiwan and poverty level among children under the age of 16 in the United States with a correlation coefficient (R) of -0.123 and weighted average of 11.0%, a difference of 43.5%.
Child Poverty Under the Age of 16 Correlation Summary
| Measurement | Colombian | Immigrants from Taiwan |
| Minimum | 6.4% | 0.75% |
| Maximum | 53.8% | 20.0% |
| Range | 47.4% | 19.3% |
| Mean | 16.2% | 8.6% |
| Median | 15.1% | 8.5% |
| Interquartile 25% (IQ1) | 12.6% | 5.7% |
| Interquartile 75% (IQ3) | 17.4% | 10.8% |
| Interquartile Range (IQR) | 4.8% | 5.1% |
| Standard Deviation (Sample) | 8.2% | 4.2% |
| Standard Deviation (Population) | 8.1% | 4.2% |
Similar Demographics by Child Poverty Under the Age of 16
Demographics Similar to Colombians by Child Poverty Under the Age of 16
In terms of child poverty under the age of 16, the demographic groups most similar to Colombians are Yugoslavian (15.8%, a difference of 0.0%), Immigrants from Germany (15.8%, a difference of 0.040%), Immigrants from Northern Africa (15.8%, a difference of 0.060%), Guamanian/Chamorro (15.9%, a difference of 0.17%), and Immigrants from Oceania (15.9%, a difference of 0.30%).
| Demographics | Rating | Rank | Child Poverty Under the Age of 16 |
| Syrians | 76.1 /100 | #155 | Good 15.6% |
| Immigrants | Venezuela | 74.9 /100 | #156 | Good 15.7% |
| Immigrants | Nepal | 72.9 /100 | #157 | Good 15.7% |
| Immigrants | Chile | 72.8 /100 | #158 | Good 15.7% |
| Immigrants | Fiji | 71.1 /100 | #159 | Good 15.8% |
| Immigrants | Albania | 70.7 /100 | #160 | Good 15.8% |
| Immigrants | Northern Africa | 68.1 /100 | #161 | Good 15.8% |
| Colombians | 67.6 /100 | #162 | Good 15.8% |
| Yugoslavians | 67.6 /100 | #163 | Good 15.8% |
| Immigrants | Germany | 67.3 /100 | #164 | Good 15.8% |
| Guamanians/Chamorros | 66.4 /100 | #165 | Good 15.9% |
| Immigrants | Oceania | 65.4 /100 | #166 | Good 15.9% |
| Costa Ricans | 61.1 /100 | #167 | Good 16.0% |
| South Americans | 57.9 /100 | #168 | Average 16.0% |
| Uruguayans | 54.7 /100 | #169 | Average 16.1% |
Demographics Similar to Immigrants from Taiwan by Child Poverty Under the Age of 16
In terms of child poverty under the age of 16, the demographic groups most similar to Immigrants from Taiwan are Filipino (11.1%, a difference of 0.85%), Immigrants from India (10.8%, a difference of 2.5%), Thai (11.6%, a difference of 4.8%), Chinese (11.9%, a difference of 8.0%), and Immigrants from Hong Kong (12.1%, a difference of 10.0%).
| Demographics | Rating | Rank | Child Poverty Under the Age of 16 |
| Immigrants | India | 100.0 /100 | #1 | Exceptional 10.8% |
| Immigrants | Taiwan | 100.0 /100 | #2 | Exceptional 11.0% |
| Filipinos | 100.0 /100 | #3 | Exceptional 11.1% |
| Thais | 100.0 /100 | #4 | Exceptional 11.6% |
| Chinese | 100.0 /100 | #5 | Exceptional 11.9% |
| Immigrants | Hong Kong | 100.0 /100 | #6 | Exceptional 12.1% |
| Iranians | 100.0 /100 | #7 | Exceptional 12.2% |
| Immigrants | Singapore | 100.0 /100 | #8 | Exceptional 12.4% |
| Immigrants | Iran | 100.0 /100 | #9 | Exceptional 12.4% |
| Immigrants | South Central Asia | 99.9 /100 | #10 | Exceptional 12.5% |
| Bhutanese | 99.9 /100 | #11 | Exceptional 12.5% |
| Immigrants | Ireland | 99.9 /100 | #12 | Exceptional 12.7% |
| Burmese | 99.9 /100 | #13 | Exceptional 12.8% |
| Immigrants | Lithuania | 99.9 /100 | #14 | Exceptional 12.9% |
| Immigrants | Korea | 99.9 /100 | #15 | Exceptional 13.0% |