Yaqui vs Laotian Single Father Poverty
COMPARE
Yaqui
Laotian
Single Father Poverty
Single Father Poverty Comparison
Yaqui
Laotians
15.6%
SINGLE FATHER POVERTY
98.1/ 100
METRIC RATING
97th/ 347
METRIC RANK
15.1%
SINGLE FATHER POVERTY
99.9/ 100
METRIC RATING
57th/ 347
METRIC RANK
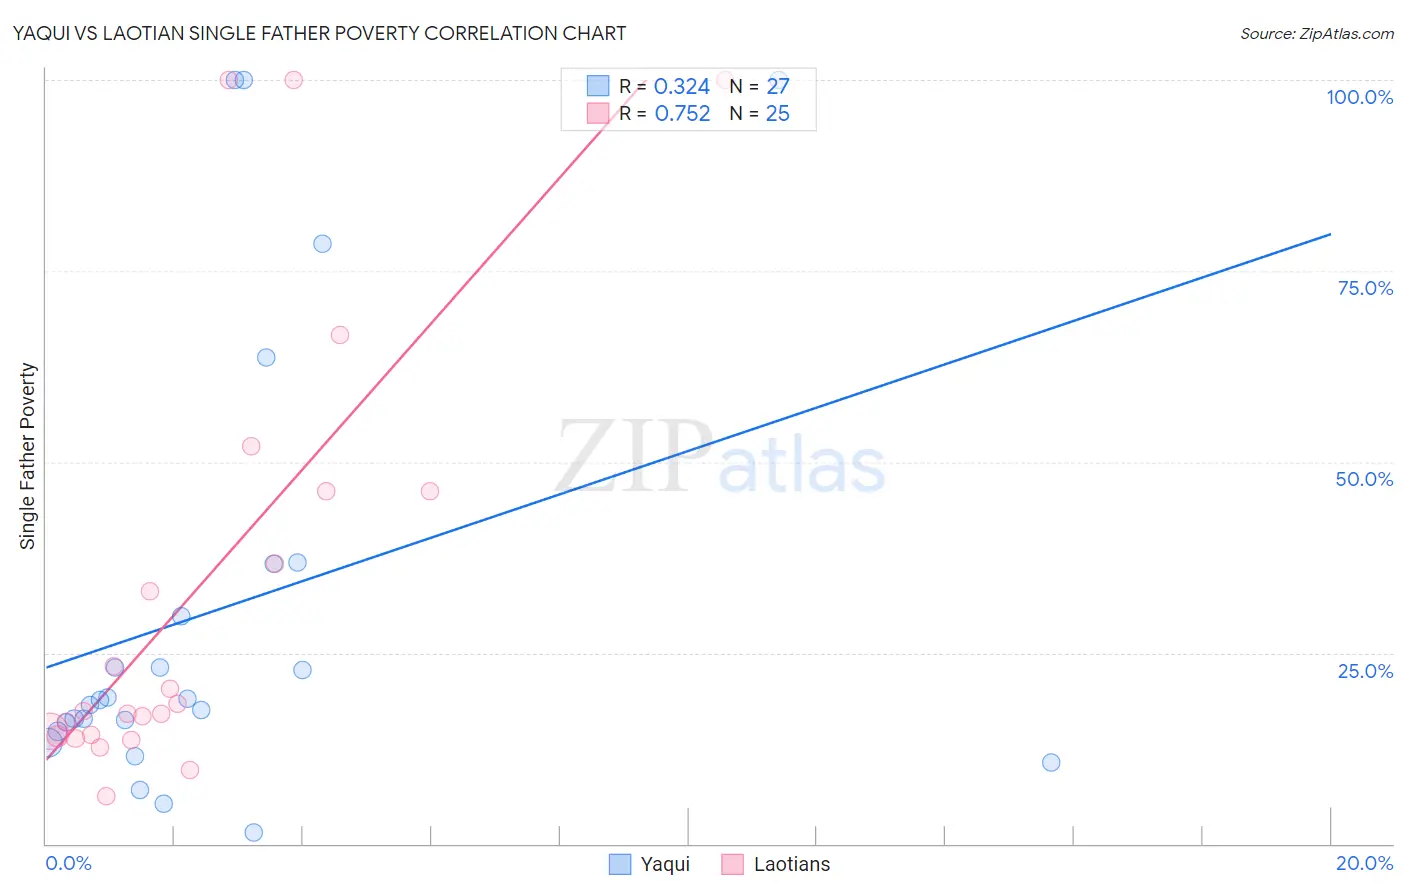
Yaqui vs Laotian Single Father Poverty Correlation Chart
The statistical analysis conducted on geographies consisting of 98,465,633 people shows a mild positive correlation between the proportion of Yaqui and poverty level among single fathers in the United States with a correlation coefficient (R) of 0.324 and weighted average of 15.6%. Similarly, the statistical analysis conducted on geographies consisting of 189,346,173 people shows a strong positive correlation between the proportion of Laotians and poverty level among single fathers in the United States with a correlation coefficient (R) of 0.752 and weighted average of 15.1%, a difference of 3.4%.
Single Father Poverty Correlation Summary
| Measurement | Yaqui | Laotian |
| Minimum | 1.4% | 6.3% |
| Maximum | 100.0% | 100.0% |
| Range | 98.6% | 93.7% |
| Mean | 30.9% | 33.0% |
| Median | 18.8% | 17.4% |
| Interquartile 25% (IQ1) | 14.8% | 14.1% |
| Interquartile 75% (IQ3) | 36.7% | 46.1% |
| Interquartile Range (IQR) | 22.0% | 32.0% |
| Standard Deviation (Sample) | 29.8% | 29.3% |
| Standard Deviation (Population) | 29.2% | 28.7% |
Similar Demographics by Single Father Poverty
Demographics Similar to Yaqui by Single Father Poverty
In terms of single father poverty, the demographic groups most similar to Yaqui are Immigrants from Belgium (15.6%, a difference of 0.010%), Zimbabwean (15.6%, a difference of 0.010%), Immigrants from Kazakhstan (15.6%, a difference of 0.020%), Immigrants from Uruguay (15.6%, a difference of 0.070%), and Basque (15.5%, a difference of 0.21%).
| Demographics | Rating | Rank | Single Father Poverty |
| Mexican American Indians | 98.7 /100 | #90 | Exceptional 15.5% |
| Immigrants | Romania | 98.6 /100 | #91 | Exceptional 15.5% |
| Immigrants | Serbia | 98.5 /100 | #92 | Exceptional 15.5% |
| Basques | 98.4 /100 | #93 | Exceptional 15.5% |
| Immigrants | Uruguay | 98.2 /100 | #94 | Exceptional 15.6% |
| Immigrants | Kazakhstan | 98.2 /100 | #95 | Exceptional 15.6% |
| Immigrants | Belgium | 98.1 /100 | #96 | Exceptional 15.6% |
| Yaqui | 98.1 /100 | #97 | Exceptional 15.6% |
| Zimbabweans | 98.1 /100 | #98 | Exceptional 15.6% |
| Immigrants | Middle Africa | 97.4 /100 | #99 | Exceptional 15.6% |
| Immigrants | Chile | 96.9 /100 | #100 | Exceptional 15.7% |
| Fijians | 96.8 /100 | #101 | Exceptional 15.7% |
| Chileans | 96.4 /100 | #102 | Exceptional 15.7% |
| South American Indians | 96.2 /100 | #103 | Exceptional 15.7% |
| Australians | 96.1 /100 | #104 | Exceptional 15.7% |
Demographics Similar to Laotians by Single Father Poverty
In terms of single father poverty, the demographic groups most similar to Laotians are Hawaiian (15.1%, a difference of 0.060%), Immigrants from Laos (15.1%, a difference of 0.090%), Guamanian/Chamorro (15.1%, a difference of 0.15%), Immigrants from Bulgaria (15.0%, a difference of 0.36%), and Immigrants from Uzbekistan (15.0%, a difference of 0.41%).
| Demographics | Rating | Rank | Single Father Poverty |
| Bhutanese | 99.9 /100 | #50 | Exceptional 15.0% |
| Immigrants | Pakistan | 99.9 /100 | #51 | Exceptional 15.0% |
| Immigrants | El Salvador | 99.9 /100 | #52 | Exceptional 15.0% |
| Immigrants | Kenya | 99.9 /100 | #53 | Exceptional 15.0% |
| Immigrants | Uzbekistan | 99.9 /100 | #54 | Exceptional 15.0% |
| Immigrants | Bulgaria | 99.9 /100 | #55 | Exceptional 15.0% |
| Immigrants | Laos | 99.9 /100 | #56 | Exceptional 15.1% |
| Laotians | 99.9 /100 | #57 | Exceptional 15.1% |
| Hawaiians | 99.9 /100 | #58 | Exceptional 15.1% |
| Guamanians/Chamorros | 99.9 /100 | #59 | Exceptional 15.1% |
| Puget Sound Salish | 99.8 /100 | #60 | Exceptional 15.2% |
| Immigrants | Bosnia and Herzegovina | 99.8 /100 | #61 | Exceptional 15.2% |
| Immigrants | Armenia | 99.8 /100 | #62 | Exceptional 15.2% |
| Immigrants | Sweden | 99.8 /100 | #63 | Exceptional 15.2% |
| Bangladeshis | 99.8 /100 | #64 | Exceptional 15.2% |