Finnish vs Asian Single Male Poverty
COMPARE
Finnish
Asian
Single Male Poverty
Single Male Poverty Comparison
Finns
Asians
13.6%
SINGLE MALE POVERTY
0.9/ 100
METRIC RATING
252nd/ 347
METRIC RANK
11.2%
SINGLE MALE POVERTY
100.0/ 100
METRIC RATING
21st/ 347
METRIC RANK
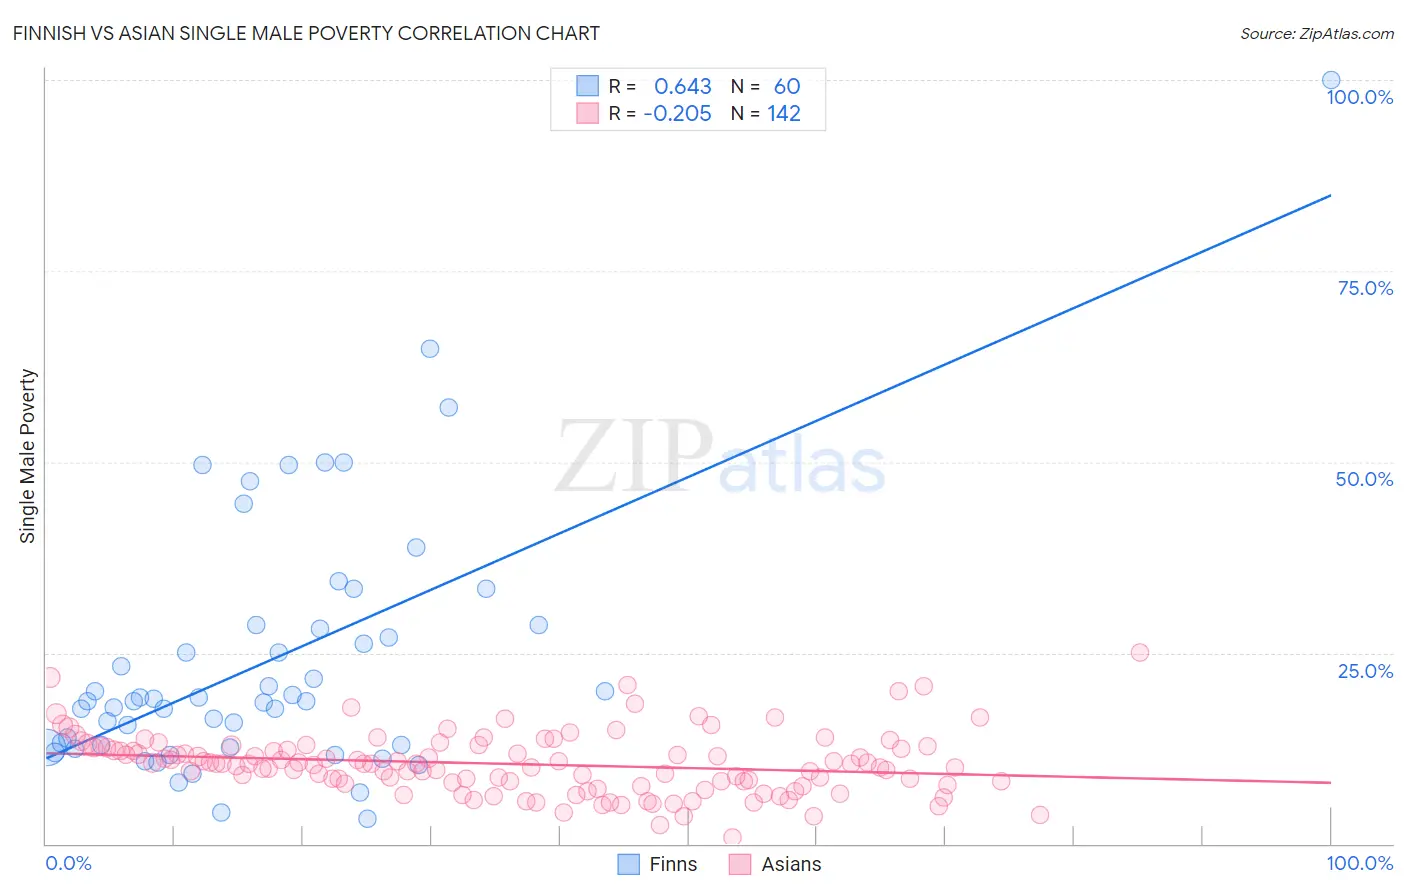
Finnish vs Asian Single Male Poverty Correlation Chart
The statistical analysis conducted on geographies consisting of 351,753,879 people shows a significant positive correlation between the proportion of Finns and poverty level among single males in the United States with a correlation coefficient (R) of 0.643 and weighted average of 13.6%. Similarly, the statistical analysis conducted on geographies consisting of 462,594,480 people shows a weak negative correlation between the proportion of Asians and poverty level among single males in the United States with a correlation coefficient (R) of -0.205 and weighted average of 11.2%, a difference of 21.4%.
Single Male Poverty Correlation Summary
| Measurement | Finnish | Asian |
| Minimum | 3.3% | 0.83% |
| Maximum | 100.0% | 25.0% |
| Range | 96.7% | 24.2% |
| Mean | 23.9% | 10.5% |
| Median | 18.6% | 10.5% |
| Interquartile 25% (IQ1) | 12.8% | 8.1% |
| Interquartile 75% (IQ3) | 28.3% | 12.7% |
| Interquartile Range (IQR) | 15.6% | 4.6% |
| Standard Deviation (Sample) | 17.0% | 4.0% |
| Standard Deviation (Population) | 16.9% | 4.0% |
Similar Demographics by Single Male Poverty
Demographics Similar to Finns by Single Male Poverty
In terms of single male poverty, the demographic groups most similar to Finns are Immigrants from Zaire (13.6%, a difference of 0.050%), German Russian (13.6%, a difference of 0.14%), Immigrants from Somalia (13.6%, a difference of 0.15%), Spanish (13.6%, a difference of 0.17%), and Czech (13.5%, a difference of 0.41%).
| Demographics | Rating | Rank | Single Male Poverty |
| Immigrants | Latin America | 1.3 /100 | #245 | Tragic 13.5% |
| Immigrants | Micronesia | 1.2 /100 | #246 | Tragic 13.5% |
| Belgians | 1.2 /100 | #247 | Tragic 13.5% |
| Czechs | 1.2 /100 | #248 | Tragic 13.5% |
| Spanish | 1.0 /100 | #249 | Tragic 13.6% |
| Immigrants | Somalia | 1.0 /100 | #250 | Tragic 13.6% |
| Immigrants | Zaire | 0.9 /100 | #251 | Tragic 13.6% |
| Finns | 0.9 /100 | #252 | Tragic 13.6% |
| German Russians | 0.8 /100 | #253 | Tragic 13.6% |
| Sub-Saharan Africans | 0.5 /100 | #254 | Tragic 13.7% |
| Spaniards | 0.4 /100 | #255 | Tragic 13.7% |
| Immigrants | Belize | 0.4 /100 | #256 | Tragic 13.7% |
| Immigrants | Central America | 0.3 /100 | #257 | Tragic 13.8% |
| Immigrants | Guatemala | 0.3 /100 | #258 | Tragic 13.8% |
| Guatemalans | 0.3 /100 | #259 | Tragic 13.8% |
Demographics Similar to Asians by Single Male Poverty
In terms of single male poverty, the demographic groups most similar to Asians are Immigrants from Pakistan (11.2%, a difference of 0.090%), Bolivian (11.2%, a difference of 0.30%), Ethiopian (11.2%, a difference of 0.34%), Immigrants from Moldova (11.2%, a difference of 0.37%), and Indian (Asian) (11.3%, a difference of 0.50%).
| Demographics | Rating | Rank | Single Male Poverty |
| Chinese | 100.0 /100 | #14 | Exceptional 11.0% |
| Koreans | 100.0 /100 | #15 | Exceptional 11.0% |
| Bhutanese | 100.0 /100 | #16 | Exceptional 11.1% |
| Tsimshian | 100.0 /100 | #17 | Exceptional 11.1% |
| Immigrants | Bolivia | 100.0 /100 | #18 | Exceptional 11.1% |
| Immigrants | Moldova | 100.0 /100 | #19 | Exceptional 11.2% |
| Ethiopians | 100.0 /100 | #20 | Exceptional 11.2% |
| Asians | 100.0 /100 | #21 | Exceptional 11.2% |
| Immigrants | Pakistan | 100.0 /100 | #22 | Exceptional 11.2% |
| Bolivians | 100.0 /100 | #23 | Exceptional 11.2% |
| Indians (Asian) | 100.0 /100 | #24 | Exceptional 11.3% |
| Maltese | 100.0 /100 | #25 | Exceptional 11.3% |
| Immigrants | Japan | 100.0 /100 | #26 | Exceptional 11.3% |
| Immigrants | China | 100.0 /100 | #27 | Exceptional 11.4% |
| Immigrants | Asia | 100.0 /100 | #28 | Exceptional 11.4% |