Cheyenne vs Immigrants from Peru Single Female Poverty
COMPARE
Cheyenne
Immigrants from Peru
Single Female Poverty
Single Female Poverty Comparison
Cheyenne
Immigrants from Peru
30.4%
SINGLE FEMALE POVERTY
0.0/ 100
METRIC RATING
339th/ 347
METRIC RANK
19.3%
SINGLE FEMALE POVERTY
99.4/ 100
METRIC RATING
73rd/ 347
METRIC RANK
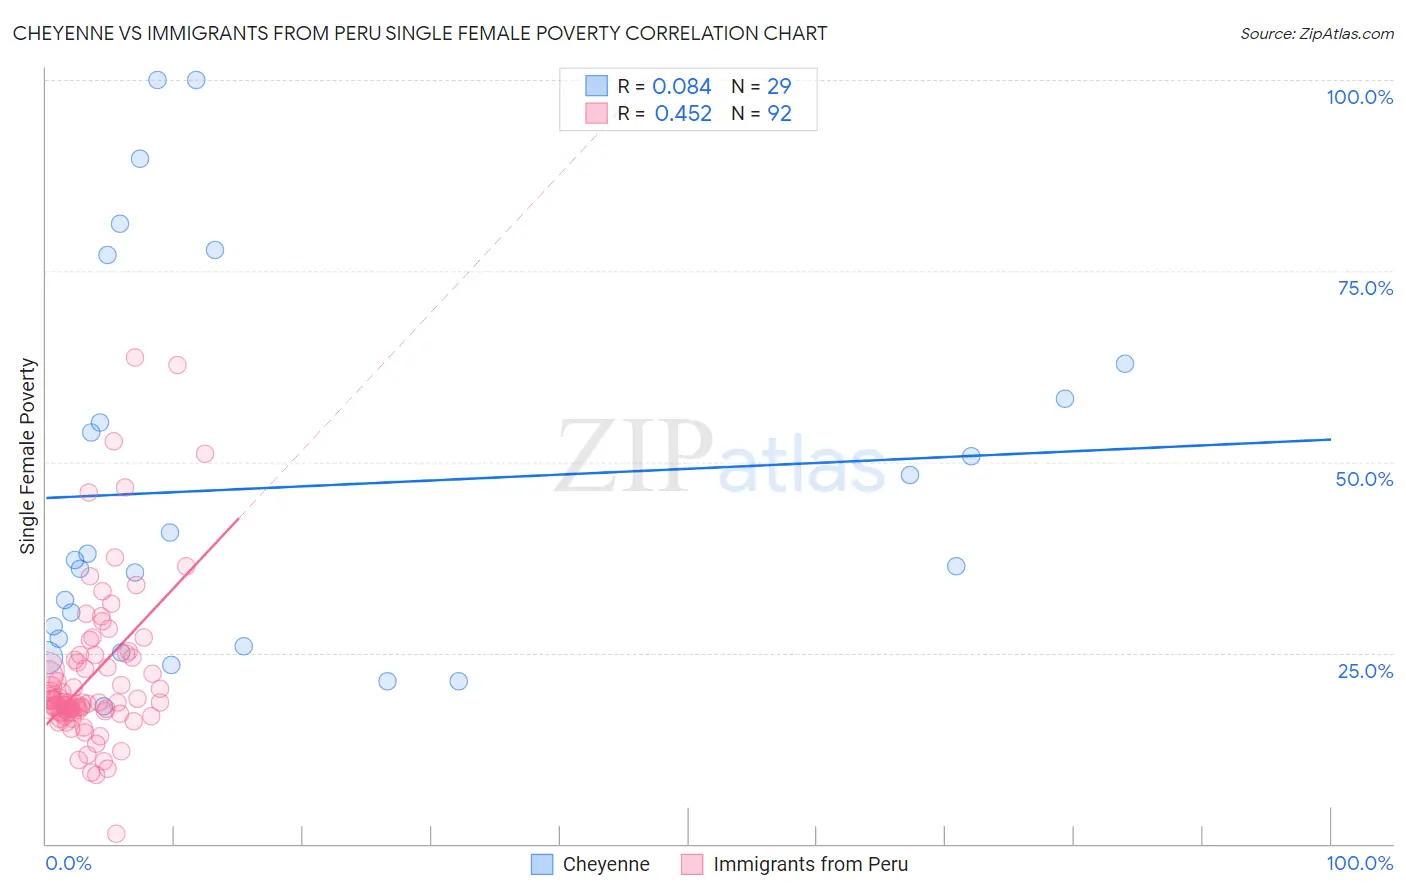
Cheyenne vs Immigrants from Peru Single Female Poverty Correlation Chart
The statistical analysis conducted on geographies consisting of 80,467,038 people shows a slight positive correlation between the proportion of Cheyenne and poverty level among single females in the United States with a correlation coefficient (R) of 0.084 and weighted average of 30.4%. Similarly, the statistical analysis conducted on geographies consisting of 325,235,635 people shows a moderate positive correlation between the proportion of Immigrants from Peru and poverty level among single females in the United States with a correlation coefficient (R) of 0.452 and weighted average of 19.3%, a difference of 57.2%.
Single Female Poverty Correlation Summary
| Measurement | Cheyenne | Immigrants from Peru |
| Minimum | 18.0% | 1.3% |
| Maximum | 100.0% | 63.6% |
| Range | 82.0% | 62.3% |
| Mean | 46.7% | 22.1% |
| Median | 37.1% | 18.5% |
| Interquartile 25% (IQ1) | 26.3% | 17.2% |
| Interquartile 75% (IQ3) | 60.6% | 24.5% |
| Interquartile Range (IQR) | 34.3% | 7.3% |
| Standard Deviation (Sample) | 24.6% | 10.5% |
| Standard Deviation (Population) | 24.2% | 10.5% |
Similar Demographics by Single Female Poverty
Demographics Similar to Cheyenne by Single Female Poverty
In terms of single female poverty, the demographic groups most similar to Cheyenne are Pima (30.3%, a difference of 0.22%), Cajun (30.6%, a difference of 0.81%), Sioux (31.3%, a difference of 2.8%), Yuman (29.4%, a difference of 3.2%), and Navajo (31.7%, a difference of 4.1%).
| Demographics | Rating | Rank | Single Female Poverty |
| Yakama | 0.0 /100 | #332 | Tragic 28.3% |
| Ute | 0.0 /100 | #333 | Tragic 28.4% |
| Pueblo | 0.0 /100 | #334 | Tragic 28.6% |
| Immigrants | Yemen | 0.0 /100 | #335 | Tragic 28.9% |
| Colville | 0.0 /100 | #336 | Tragic 29.1% |
| Yuman | 0.0 /100 | #337 | Tragic 29.4% |
| Pima | 0.0 /100 | #338 | Tragic 30.3% |
| Cheyenne | 0.0 /100 | #339 | Tragic 30.4% |
| Cajuns | 0.0 /100 | #340 | Tragic 30.6% |
| Sioux | 0.0 /100 | #341 | Tragic 31.3% |
| Navajo | 0.0 /100 | #342 | Tragic 31.7% |
| Crow | 0.0 /100 | #343 | Tragic 32.4% |
| Lumbee | 0.0 /100 | #344 | Tragic 33.0% |
| Houma | 0.0 /100 | #345 | Tragic 33.8% |
| Puerto Ricans | 0.0 /100 | #346 | Tragic 34.1% |
Demographics Similar to Immigrants from Peru by Single Female Poverty
In terms of single female poverty, the demographic groups most similar to Immigrants from Peru are Immigrants from Belarus (19.3%, a difference of 0.010%), Immigrants from Turkey (19.4%, a difference of 0.050%), Peruvian (19.4%, a difference of 0.090%), Immigrants from South Eastern Asia (19.3%, a difference of 0.10%), and Immigrants from Latvia (19.3%, a difference of 0.10%).
| Demographics | Rating | Rank | Single Female Poverty |
| Palestinians | 99.6 /100 | #66 | Exceptional 19.2% |
| Immigrants | Egypt | 99.6 /100 | #67 | Exceptional 19.2% |
| Laotians | 99.5 /100 | #68 | Exceptional 19.3% |
| Paraguayans | 99.5 /100 | #69 | Exceptional 19.3% |
| Immigrants | Jordan | 99.4 /100 | #70 | Exceptional 19.3% |
| Immigrants | South Eastern Asia | 99.4 /100 | #71 | Exceptional 19.3% |
| Immigrants | Latvia | 99.4 /100 | #72 | Exceptional 19.3% |
| Immigrants | Peru | 99.4 /100 | #73 | Exceptional 19.3% |
| Immigrants | Belarus | 99.4 /100 | #74 | Exceptional 19.3% |
| Immigrants | Turkey | 99.4 /100 | #75 | Exceptional 19.4% |
| Peruvians | 99.4 /100 | #76 | Exceptional 19.4% |
| Immigrants | Russia | 99.3 /100 | #77 | Exceptional 19.4% |
| Albanians | 99.3 /100 | #78 | Exceptional 19.4% |
| Immigrants | Sierra Leone | 99.3 /100 | #79 | Exceptional 19.4% |
| Immigrants | Australia | 99.3 /100 | #80 | Exceptional 19.4% |