Immigrants from Uzbekistan vs Immigrants from Peru Single Female Poverty
COMPARE
Immigrants from Uzbekistan
Immigrants from Peru
Single Female Poverty
Single Female Poverty Comparison
Immigrants from Uzbekistan
Immigrants from Peru
20.3%
SINGLE FEMALE POVERTY
88.3/ 100
METRIC RATING
144th/ 347
METRIC RANK
19.3%
SINGLE FEMALE POVERTY
99.4/ 100
METRIC RATING
73rd/ 347
METRIC RANK
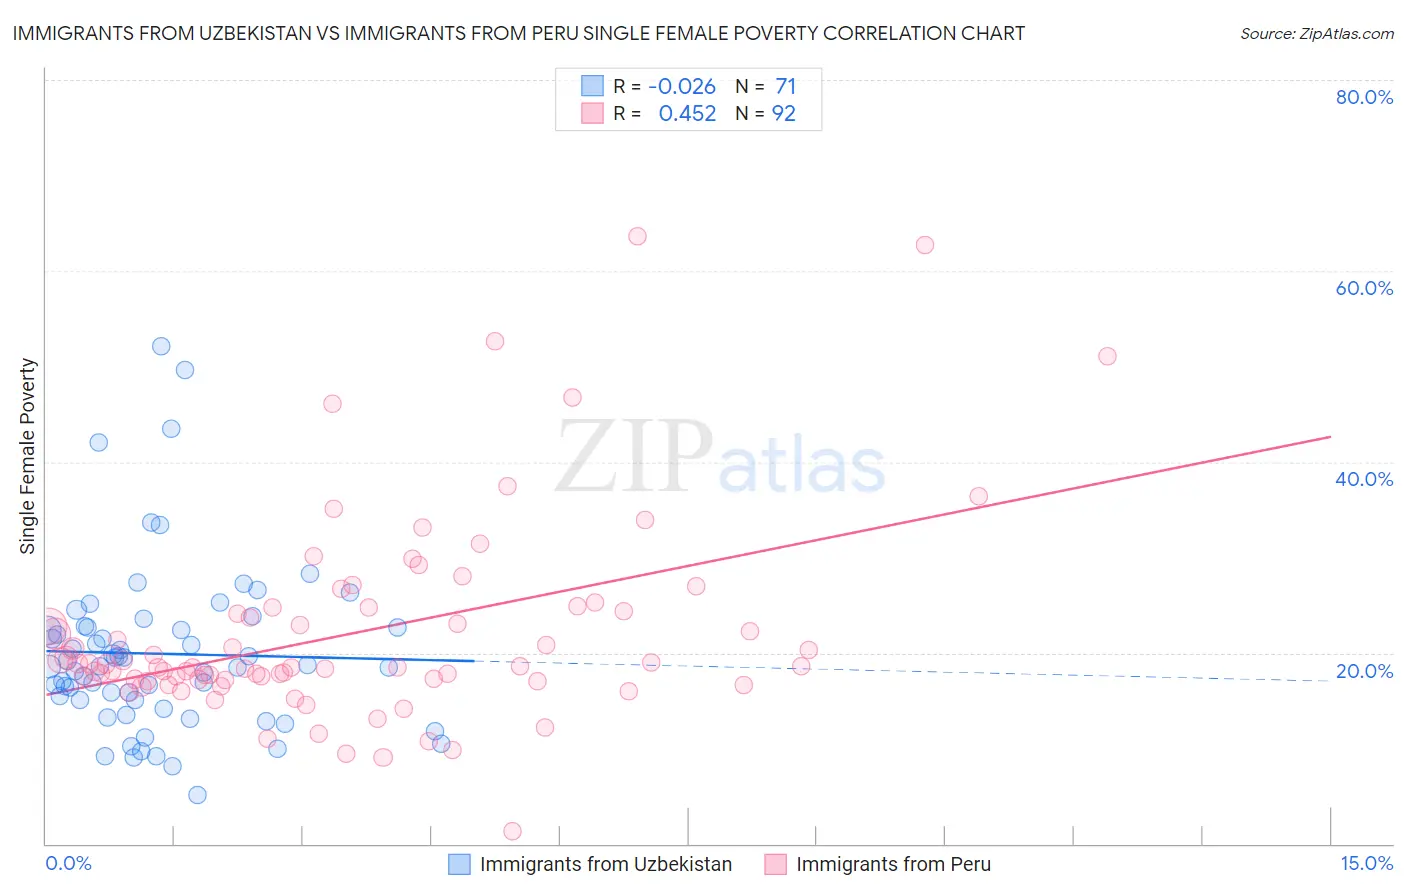
Immigrants from Uzbekistan vs Immigrants from Peru Single Female Poverty Correlation Chart
The statistical analysis conducted on geographies consisting of 118,122,689 people shows no correlation between the proportion of Immigrants from Uzbekistan and poverty level among single females in the United States with a correlation coefficient (R) of -0.026 and weighted average of 20.3%. Similarly, the statistical analysis conducted on geographies consisting of 325,235,635 people shows a moderate positive correlation between the proportion of Immigrants from Peru and poverty level among single females in the United States with a correlation coefficient (R) of 0.452 and weighted average of 19.3%, a difference of 5.2%.
Single Female Poverty Correlation Summary
| Measurement | Immigrants from Uzbekistan | Immigrants from Peru |
| Minimum | 5.1% | 1.3% |
| Maximum | 52.0% | 63.6% |
| Range | 46.9% | 62.3% |
| Mean | 19.9% | 22.1% |
| Median | 18.6% | 18.5% |
| Interquartile 25% (IQ1) | 15.0% | 17.2% |
| Interquartile 75% (IQ3) | 22.7% | 24.5% |
| Interquartile Range (IQR) | 7.7% | 7.3% |
| Standard Deviation (Sample) | 8.8% | 10.5% |
| Standard Deviation (Population) | 8.8% | 10.5% |
Similar Demographics by Single Female Poverty
Demographics Similar to Immigrants from Uzbekistan by Single Female Poverty
In terms of single female poverty, the demographic groups most similar to Immigrants from Uzbekistan are Australian (20.3%, a difference of 0.010%), Immigrants from Uganda (20.3%, a difference of 0.13%), Immigrants from North America (20.3%, a difference of 0.20%), Syrian (20.3%, a difference of 0.35%), and Immigrants from Kuwait (20.3%, a difference of 0.36%).
| Demographics | Rating | Rank | Single Female Poverty |
| Immigrants | Nepal | 90.6 /100 | #137 | Exceptional 20.3% |
| Slovenes | 90.5 /100 | #138 | Exceptional 20.3% |
| Immigrants | Kuwait | 90.4 /100 | #139 | Exceptional 20.3% |
| Syrians | 90.4 /100 | #140 | Exceptional 20.3% |
| Immigrants | North America | 89.5 /100 | #141 | Excellent 20.3% |
| Immigrants | Uganda | 89.1 /100 | #142 | Excellent 20.3% |
| Australians | 88.4 /100 | #143 | Excellent 20.3% |
| Immigrants | Uzbekistan | 88.3 /100 | #144 | Excellent 20.3% |
| Austrians | 85.8 /100 | #145 | Excellent 20.4% |
| Venezuelans | 85.5 /100 | #146 | Excellent 20.4% |
| South Africans | 85.3 /100 | #147 | Excellent 20.4% |
| Luxembourgers | 84.9 /100 | #148 | Excellent 20.4% |
| Portuguese | 81.5 /100 | #149 | Excellent 20.5% |
| Immigrants | Denmark | 80.5 /100 | #150 | Excellent 20.5% |
| Puget Sound Salish | 79.6 /100 | #151 | Good 20.6% |
Demographics Similar to Immigrants from Peru by Single Female Poverty
In terms of single female poverty, the demographic groups most similar to Immigrants from Peru are Immigrants from Belarus (19.3%, a difference of 0.010%), Immigrants from Turkey (19.4%, a difference of 0.050%), Peruvian (19.4%, a difference of 0.090%), Immigrants from South Eastern Asia (19.3%, a difference of 0.10%), and Immigrants from Latvia (19.3%, a difference of 0.10%).
| Demographics | Rating | Rank | Single Female Poverty |
| Palestinians | 99.6 /100 | #66 | Exceptional 19.2% |
| Immigrants | Egypt | 99.6 /100 | #67 | Exceptional 19.2% |
| Laotians | 99.5 /100 | #68 | Exceptional 19.3% |
| Paraguayans | 99.5 /100 | #69 | Exceptional 19.3% |
| Immigrants | Jordan | 99.4 /100 | #70 | Exceptional 19.3% |
| Immigrants | South Eastern Asia | 99.4 /100 | #71 | Exceptional 19.3% |
| Immigrants | Latvia | 99.4 /100 | #72 | Exceptional 19.3% |
| Immigrants | Peru | 99.4 /100 | #73 | Exceptional 19.3% |
| Immigrants | Belarus | 99.4 /100 | #74 | Exceptional 19.3% |
| Immigrants | Turkey | 99.4 /100 | #75 | Exceptional 19.4% |
| Peruvians | 99.4 /100 | #76 | Exceptional 19.4% |
| Immigrants | Russia | 99.3 /100 | #77 | Exceptional 19.4% |
| Albanians | 99.3 /100 | #78 | Exceptional 19.4% |
| Immigrants | Sierra Leone | 99.3 /100 | #79 | Exceptional 19.4% |
| Immigrants | Australia | 99.3 /100 | #80 | Exceptional 19.4% |