Cherokee vs Cuban Poverty
COMPARE
Cherokee
Cuban
Poverty
Poverty Comparison
Cherokee
Cubans
14.4%
POVERTY
0.1/ 100
METRIC RATING
261st/ 347
METRIC RANK
13.9%
POVERTY
0.6/ 100
METRIC RATING
235th/ 347
METRIC RANK
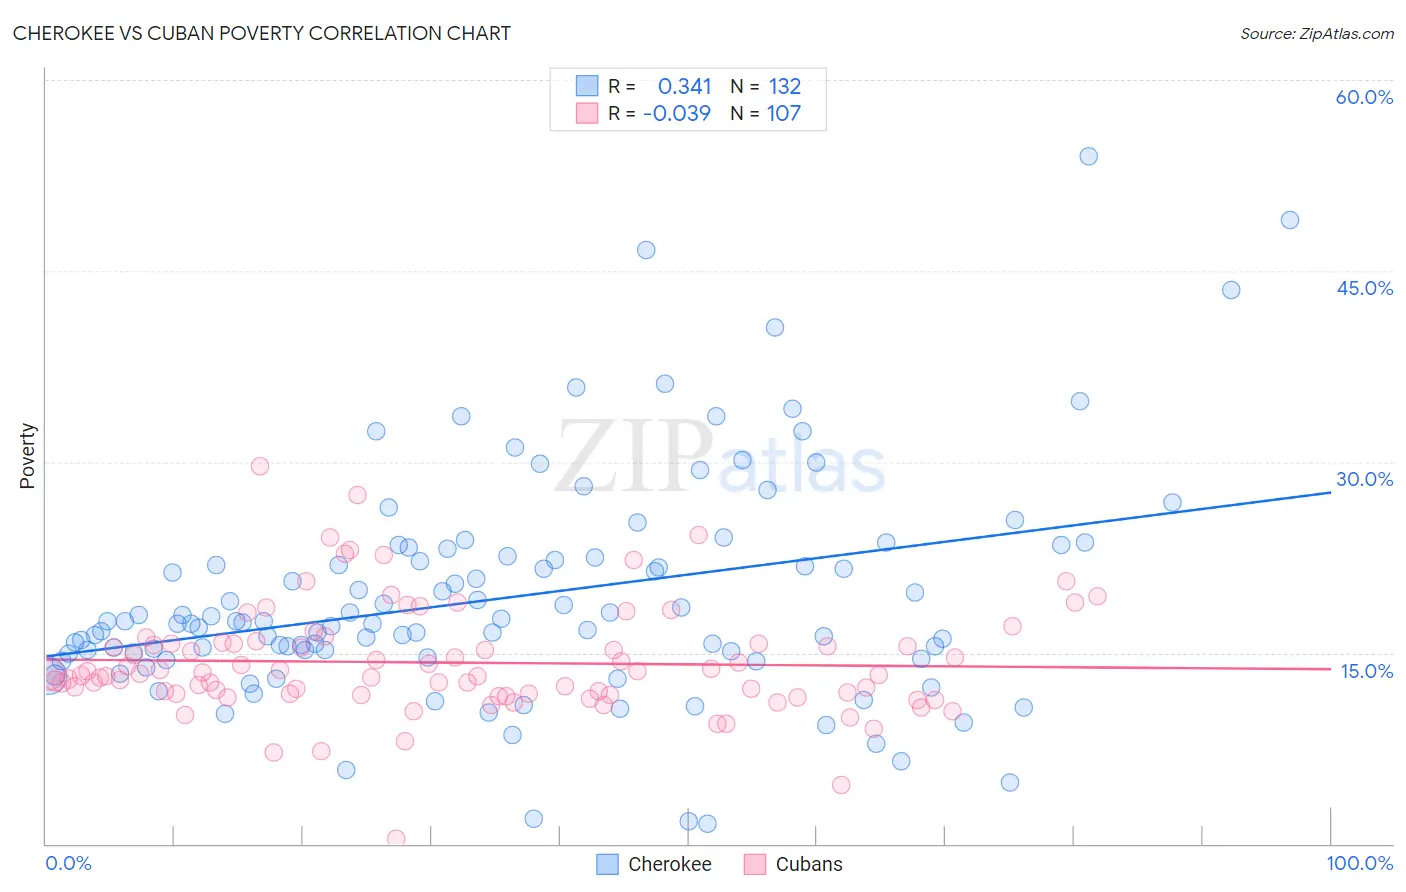
Cherokee vs Cuban Poverty Correlation Chart
The statistical analysis conducted on geographies consisting of 493,337,715 people shows a mild positive correlation between the proportion of Cherokee and poverty level in the United States with a correlation coefficient (R) of 0.341 and weighted average of 14.4%. Similarly, the statistical analysis conducted on geographies consisting of 448,978,860 people shows no correlation between the proportion of Cubans and poverty level in the United States with a correlation coefficient (R) of -0.039 and weighted average of 13.9%, a difference of 3.5%.
Poverty Correlation Summary
| Measurement | Cherokee | Cuban |
| Minimum | 1.6% | 0.38% |
| Maximum | 54.1% | 29.6% |
| Range | 52.4% | 29.3% |
| Mean | 19.3% | 14.2% |
| Median | 17.3% | 13.3% |
| Interquartile 25% (IQ1) | 14.8% | 11.8% |
| Interquartile 75% (IQ3) | 22.5% | 15.7% |
| Interquartile Range (IQR) | 7.7% | 4.0% |
| Standard Deviation (Sample) | 8.8% | 4.3% |
| Standard Deviation (Population) | 8.8% | 4.3% |
Similar Demographics by Poverty
Demographics Similar to Cherokee by Poverty
In terms of poverty, the demographic groups most similar to Cherokee are Cape Verdean (14.4%, a difference of 0.020%), Immigrants from Nicaragua (14.3%, a difference of 0.10%), Immigrants from Liberia (14.4%, a difference of 0.16%), Ottawa (14.3%, a difference of 0.37%), and Trinidadian and Tobagonian (14.3%, a difference of 0.38%).
| Demographics | Rating | Rank | Poverty |
| Immigrants | El Salvador | 0.1 /100 | #254 | Tragic 14.3% |
| Immigrants | Ecuador | 0.1 /100 | #255 | Tragic 14.3% |
| Mexican American Indians | 0.1 /100 | #256 | Tragic 14.3% |
| Trinidadians and Tobagonians | 0.1 /100 | #257 | Tragic 14.3% |
| Ottawa | 0.1 /100 | #258 | Tragic 14.3% |
| Immigrants | Nicaragua | 0.1 /100 | #259 | Tragic 14.3% |
| Cape Verdeans | 0.1 /100 | #260 | Tragic 14.4% |
| Cherokee | 0.1 /100 | #261 | Tragic 14.4% |
| Immigrants | Liberia | 0.1 /100 | #262 | Tragic 14.4% |
| Jamaicans | 0.1 /100 | #263 | Tragic 14.4% |
| Immigrants | Jamaica | 0.1 /100 | #264 | Tragic 14.4% |
| Immigrants | Guyana | 0.1 /100 | #265 | Tragic 14.5% |
| Guyanese | 0.1 /100 | #266 | Tragic 14.5% |
| Iroquois | 0.1 /100 | #267 | Tragic 14.5% |
| Sub-Saharan Africans | 0.1 /100 | #268 | Tragic 14.5% |
Demographics Similar to Cubans by Poverty
In terms of poverty, the demographic groups most similar to Cubans are Immigrants from Armenia (13.9%, a difference of 0.040%), French American Indian (13.9%, a difference of 0.060%), Ghanaian (13.9%, a difference of 0.19%), Immigrants from Laos (13.8%, a difference of 0.44%), and Nicaraguan (13.9%, a difference of 0.54%).
| Demographics | Rating | Rank | Poverty |
| Immigrants | Nigeria | 1.7 /100 | #228 | Tragic 13.5% |
| Osage | 1.5 /100 | #229 | Tragic 13.6% |
| Alaskan Athabascans | 1.5 /100 | #230 | Tragic 13.6% |
| Nigerians | 1.4 /100 | #231 | Tragic 13.6% |
| Fijians | 0.8 /100 | #232 | Tragic 13.7% |
| Immigrants | Saudi Arabia | 0.8 /100 | #233 | Tragic 13.8% |
| Immigrants | Laos | 0.7 /100 | #234 | Tragic 13.8% |
| Cubans | 0.6 /100 | #235 | Tragic 13.9% |
| Immigrants | Armenia | 0.5 /100 | #236 | Tragic 13.9% |
| French American Indians | 0.5 /100 | #237 | Tragic 13.9% |
| Ghanaians | 0.5 /100 | #238 | Tragic 13.9% |
| Nicaraguans | 0.4 /100 | #239 | Tragic 13.9% |
| Immigrants | Middle Africa | 0.4 /100 | #240 | Tragic 14.0% |
| Salvadorans | 0.4 /100 | #241 | Tragic 14.0% |
| Ecuadorians | 0.4 /100 | #242 | Tragic 14.0% |