Cherokee vs Cuban Per Capita Income
COMPARE
Cherokee
Cuban
Per Capita Income
Per Capita Income Comparison
Cherokee
Cubans
$37,203
PER CAPITA INCOME
0.1/ 100
METRIC RATING
299th/ 347
METRIC RANK
$37,383
PER CAPITA INCOME
0.1/ 100
METRIC RATING
294th/ 347
METRIC RANK
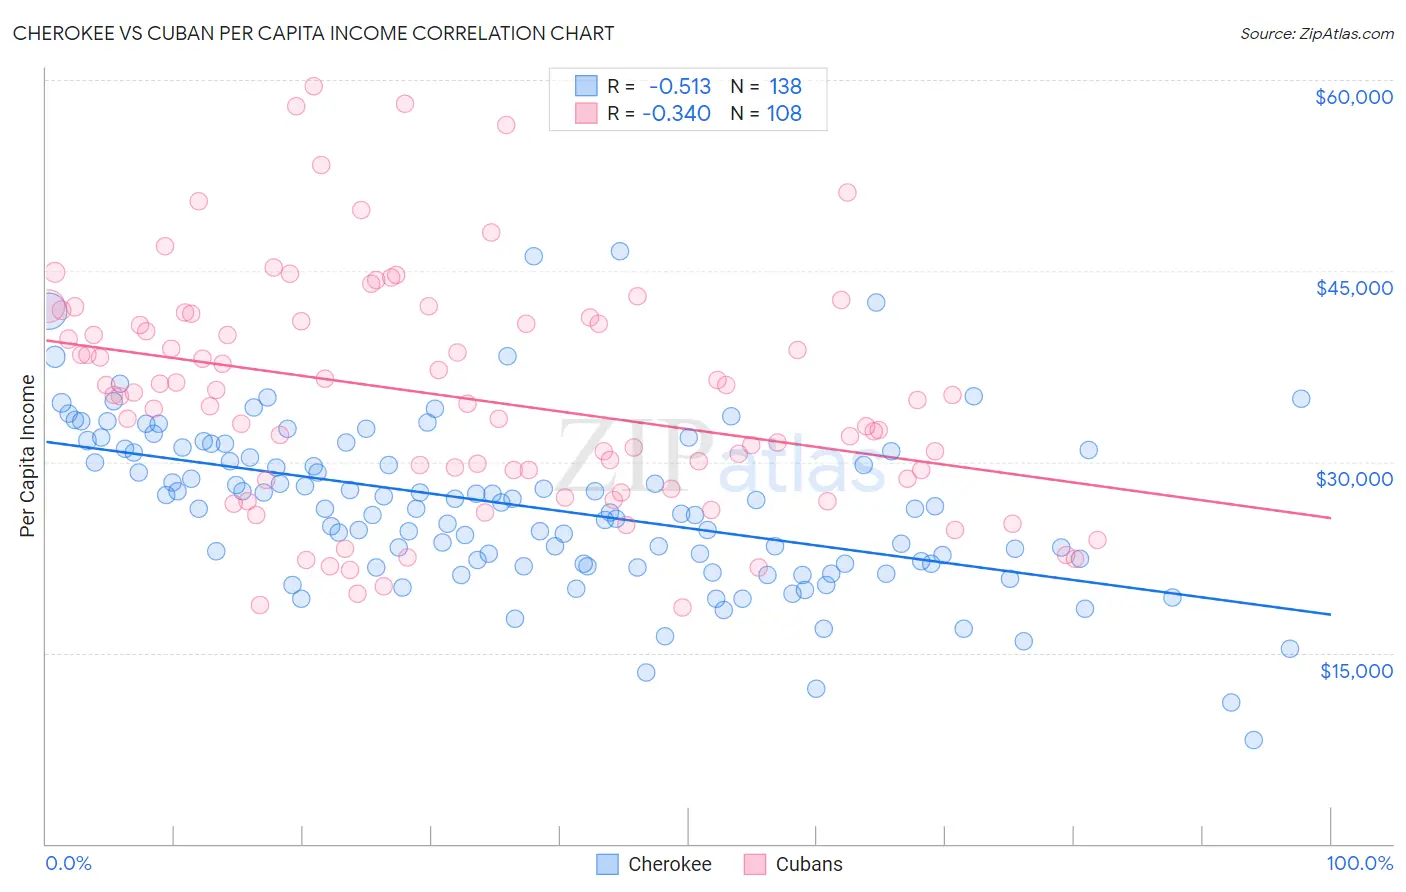
Cherokee vs Cuban Per Capita Income Correlation Chart
The statistical analysis conducted on geographies consisting of 493,739,592 people shows a substantial negative correlation between the proportion of Cherokee and per capita income in the United States with a correlation coefficient (R) of -0.513 and weighted average of $37,203. Similarly, the statistical analysis conducted on geographies consisting of 449,330,794 people shows a mild negative correlation between the proportion of Cubans and per capita income in the United States with a correlation coefficient (R) of -0.340 and weighted average of $37,383, a difference of 0.48%.
Per Capita Income Correlation Summary
| Measurement | Cherokee | Cuban |
| Minimum | $8,186 | $18,566 |
| Maximum | $46,594 | $59,513 |
| Range | $38,408 | $40,947 |
| Mean | $26,478 | $35,073 |
| Median | $26,343 | $35,004 |
| Interquartile 25% (IQ1) | $21,995 | $28,628 |
| Interquartile 75% (IQ3) | $30,981 | $40,960 |
| Interquartile Range (IQR) | $8,986 | $12,332 |
| Standard Deviation (Sample) | $6,463 | $9,056 |
| Standard Deviation (Population) | $6,439 | $9,014 |
Demographics Similar to Cherokee and Cubans by Per Capita Income
In terms of per capita income, the demographic groups most similar to Cherokee are Immigrants from Bahamas ($37,193, a difference of 0.030%), Immigrants from Caribbean ($37,254, a difference of 0.14%), Haitian ($37,289, a difference of 0.23%), Indonesian ($37,300, a difference of 0.26%), and Immigrants from Dominican Republic ($37,306, a difference of 0.27%). Similarly, the demographic groups most similar to Cubans are Mexican American Indian ($37,407, a difference of 0.070%), Immigrants from Dominican Republic ($37,306, a difference of 0.21%), Immigrants from Micronesia ($37,464, a difference of 0.22%), Indonesian ($37,300, a difference of 0.22%), and Haitian ($37,289, a difference of 0.25%).
| Demographics | Rating | Rank | Per Capita Income |
| Central American Indians | 0.1 /100 | #286 | Tragic $37,699 |
| Dominicans | 0.1 /100 | #287 | Tragic $37,697 |
| Blackfeet | 0.1 /100 | #288 | Tragic $37,695 |
| U.S. Virgin Islanders | 0.1 /100 | #289 | Tragic $37,589 |
| Immigrants | Guatemala | 0.1 /100 | #290 | Tragic $37,550 |
| Cajuns | 0.1 /100 | #291 | Tragic $37,527 |
| Immigrants | Micronesia | 0.1 /100 | #292 | Tragic $37,464 |
| Mexican American Indians | 0.1 /100 | #293 | Tragic $37,407 |
| Cubans | 0.1 /100 | #294 | Tragic $37,383 |
| Immigrants | Dominican Republic | 0.1 /100 | #295 | Tragic $37,306 |
| Indonesians | 0.1 /100 | #296 | Tragic $37,300 |
| Haitians | 0.1 /100 | #297 | Tragic $37,289 |
| Immigrants | Caribbean | 0.1 /100 | #298 | Tragic $37,254 |
| Cherokee | 0.1 /100 | #299 | Tragic $37,203 |
| Immigrants | Bahamas | 0.1 /100 | #300 | Tragic $37,193 |
| Ottawa | 0.1 /100 | #301 | Tragic $37,101 |
| Shoshone | 0.1 /100 | #302 | Tragic $37,072 |
| Paiute | 0.1 /100 | #303 | Tragic $37,066 |
| Hondurans | 0.1 /100 | #304 | Tragic $37,031 |
| Inupiat | 0.1 /100 | #305 | Tragic $36,999 |
| Immigrants | Haiti | 0.0 /100 | #306 | Tragic $36,849 |