Croatian vs Cuban Poverty
COMPARE
Croatian
Cuban
Poverty
Poverty Comparison
Croatians
Cubans
10.6%
POVERTY
99.6/ 100
METRIC RATING
25th/ 347
METRIC RANK
13.9%
POVERTY
0.6/ 100
METRIC RATING
235th/ 347
METRIC RANK
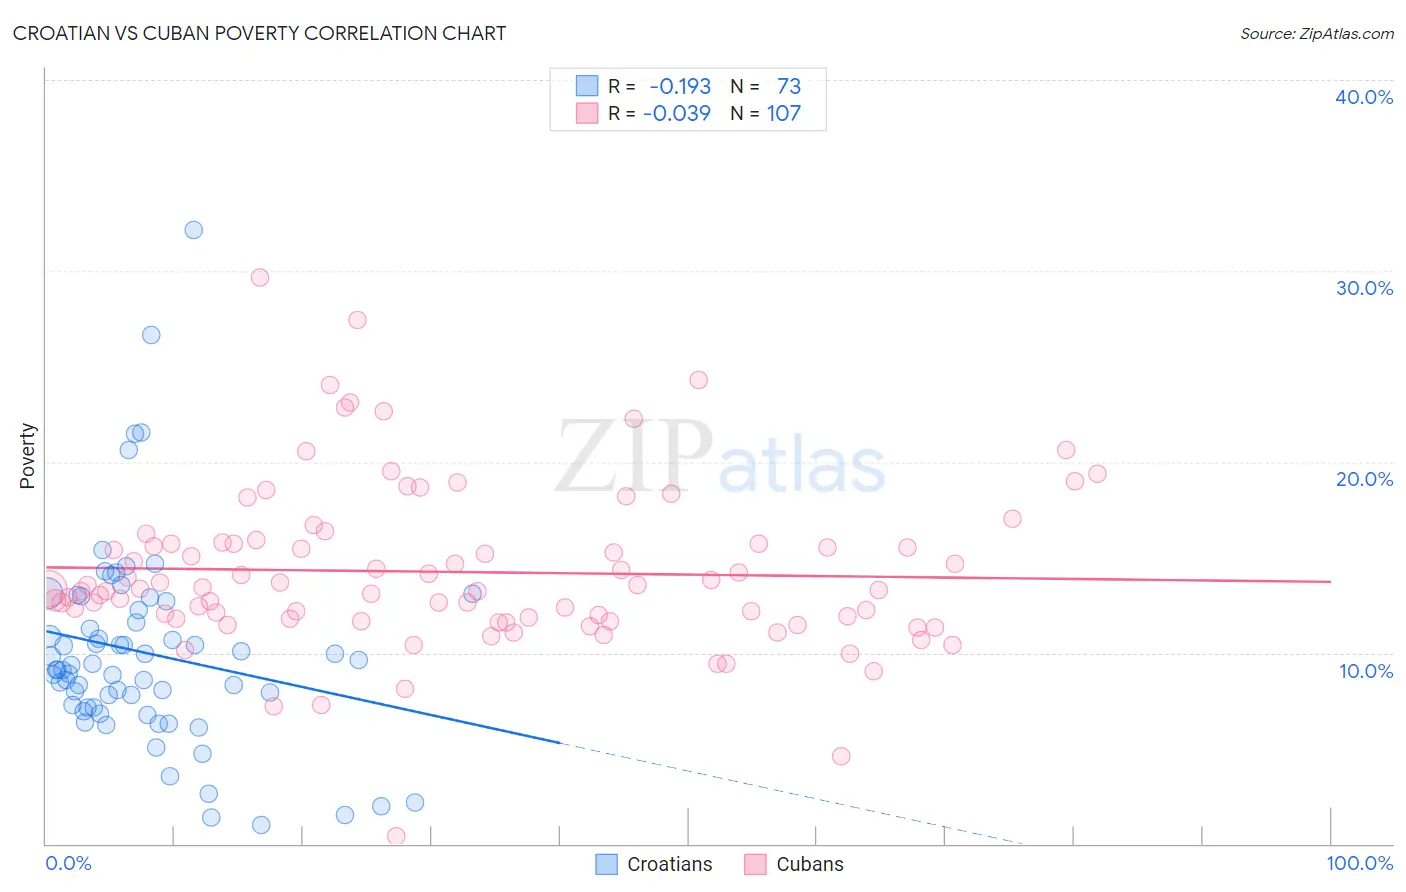
Croatian vs Cuban Poverty Correlation Chart
The statistical analysis conducted on geographies consisting of 375,543,328 people shows a poor negative correlation between the proportion of Croatians and poverty level in the United States with a correlation coefficient (R) of -0.193 and weighted average of 10.6%. Similarly, the statistical analysis conducted on geographies consisting of 448,978,860 people shows no correlation between the proportion of Cubans and poverty level in the United States with a correlation coefficient (R) of -0.039 and weighted average of 13.9%, a difference of 30.4%.
Poverty Correlation Summary
| Measurement | Croatian | Cuban |
| Minimum | 0.99% | 0.38% |
| Maximum | 32.2% | 29.6% |
| Range | 31.2% | 29.3% |
| Mean | 10.0% | 14.2% |
| Median | 9.1% | 13.3% |
| Interquartile 25% (IQ1) | 7.1% | 11.8% |
| Interquartile 75% (IQ3) | 12.5% | 15.7% |
| Interquartile Range (IQR) | 5.4% | 4.0% |
| Standard Deviation (Sample) | 5.3% | 4.3% |
| Standard Deviation (Population) | 5.3% | 4.3% |
Similar Demographics by Poverty
Demographics Similar to Croatians by Poverty
In terms of poverty, the demographic groups most similar to Croatians are Italian (10.6%, a difference of 0.19%), Swedish (10.6%, a difference of 0.24%), Burmese (10.7%, a difference of 0.31%), Eastern European (10.6%, a difference of 0.35%), and Luxembourger (10.6%, a difference of 0.51%).
| Demographics | Rating | Rank | Poverty |
| Latvians | 99.8 /100 | #18 | Exceptional 10.5% |
| Immigrants | Scotland | 99.7 /100 | #19 | Exceptional 10.6% |
| Immigrants | North Macedonia | 99.7 /100 | #20 | Exceptional 10.6% |
| Luxembourgers | 99.7 /100 | #21 | Exceptional 10.6% |
| Eastern Europeans | 99.7 /100 | #22 | Exceptional 10.6% |
| Swedes | 99.7 /100 | #23 | Exceptional 10.6% |
| Italians | 99.7 /100 | #24 | Exceptional 10.6% |
| Croatians | 99.6 /100 | #25 | Exceptional 10.6% |
| Burmese | 99.6 /100 | #26 | Exceptional 10.7% |
| Immigrants | Northern Europe | 99.6 /100 | #27 | Exceptional 10.7% |
| Immigrants | Korea | 99.5 /100 | #28 | Exceptional 10.7% |
| Greeks | 99.5 /100 | #29 | Exceptional 10.7% |
| Danes | 99.5 /100 | #30 | Exceptional 10.7% |
| Poles | 99.5 /100 | #31 | Exceptional 10.7% |
| Iranians | 99.5 /100 | #32 | Exceptional 10.7% |
Demographics Similar to Cubans by Poverty
In terms of poverty, the demographic groups most similar to Cubans are Immigrants from Armenia (13.9%, a difference of 0.040%), French American Indian (13.9%, a difference of 0.060%), Ghanaian (13.9%, a difference of 0.19%), Immigrants from Laos (13.8%, a difference of 0.44%), and Nicaraguan (13.9%, a difference of 0.54%).
| Demographics | Rating | Rank | Poverty |
| Immigrants | Nigeria | 1.7 /100 | #228 | Tragic 13.5% |
| Osage | 1.5 /100 | #229 | Tragic 13.6% |
| Alaskan Athabascans | 1.5 /100 | #230 | Tragic 13.6% |
| Nigerians | 1.4 /100 | #231 | Tragic 13.6% |
| Fijians | 0.8 /100 | #232 | Tragic 13.7% |
| Immigrants | Saudi Arabia | 0.8 /100 | #233 | Tragic 13.8% |
| Immigrants | Laos | 0.7 /100 | #234 | Tragic 13.8% |
| Cubans | 0.6 /100 | #235 | Tragic 13.9% |
| Immigrants | Armenia | 0.5 /100 | #236 | Tragic 13.9% |
| French American Indians | 0.5 /100 | #237 | Tragic 13.9% |
| Ghanaians | 0.5 /100 | #238 | Tragic 13.9% |
| Nicaraguans | 0.4 /100 | #239 | Tragic 13.9% |
| Immigrants | Middle Africa | 0.4 /100 | #240 | Tragic 14.0% |
| Salvadorans | 0.4 /100 | #241 | Tragic 14.0% |
| Ecuadorians | 0.4 /100 | #242 | Tragic 14.0% |