Cherokee vs Immigrants from Jordan Poverty
COMPARE
Cherokee
Immigrants from Jordan
Poverty
Poverty Comparison
Cherokee
Immigrants from Jordan
14.4%
POVERTY
0.1/ 100
METRIC RATING
261st/ 347
METRIC RANK
11.9%
POVERTY
82.4/ 100
METRIC RATING
138th/ 347
METRIC RANK
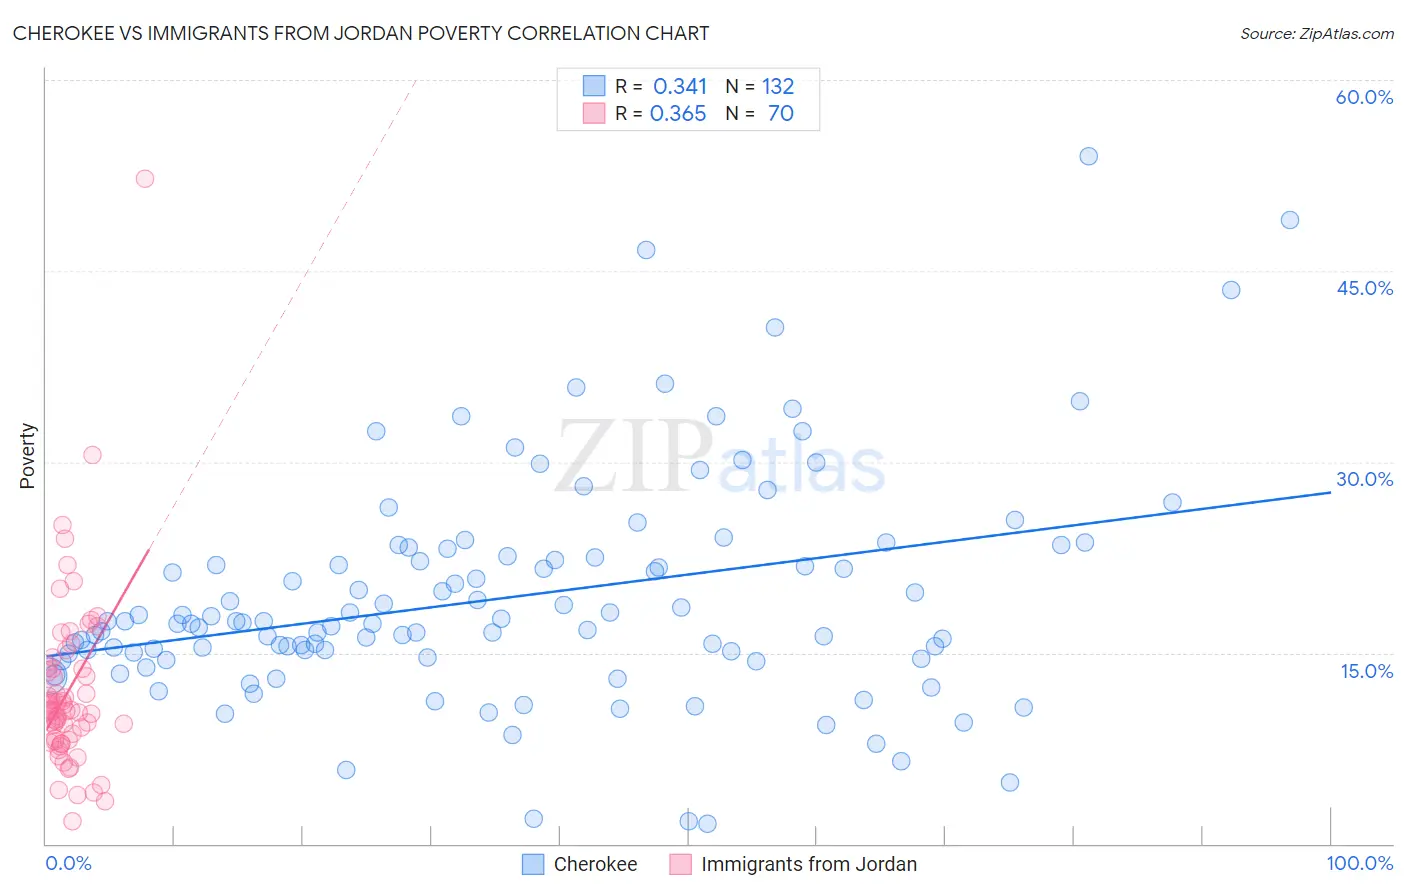
Cherokee vs Immigrants from Jordan Poverty Correlation Chart
The statistical analysis conducted on geographies consisting of 493,337,715 people shows a mild positive correlation between the proportion of Cherokee and poverty level in the United States with a correlation coefficient (R) of 0.341 and weighted average of 14.4%. Similarly, the statistical analysis conducted on geographies consisting of 181,257,123 people shows a mild positive correlation between the proportion of Immigrants from Jordan and poverty level in the United States with a correlation coefficient (R) of 0.365 and weighted average of 11.9%, a difference of 21.0%.
Poverty Correlation Summary
| Measurement | Cherokee | Immigrants from Jordan |
| Minimum | 1.6% | 1.8% |
| Maximum | 54.1% | 52.2% |
| Range | 52.4% | 50.4% |
| Mean | 19.3% | 12.0% |
| Median | 17.3% | 10.5% |
| Interquartile 25% (IQ1) | 14.8% | 8.1% |
| Interquartile 75% (IQ3) | 22.5% | 13.8% |
| Interquartile Range (IQR) | 7.7% | 5.6% |
| Standard Deviation (Sample) | 8.8% | 7.2% |
| Standard Deviation (Population) | 8.8% | 7.1% |
Similar Demographics by Poverty
Demographics Similar to Cherokee by Poverty
In terms of poverty, the demographic groups most similar to Cherokee are Cape Verdean (14.4%, a difference of 0.020%), Immigrants from Nicaragua (14.3%, a difference of 0.10%), Immigrants from Liberia (14.4%, a difference of 0.16%), Ottawa (14.3%, a difference of 0.37%), and Trinidadian and Tobagonian (14.3%, a difference of 0.38%).
| Demographics | Rating | Rank | Poverty |
| Immigrants | El Salvador | 0.1 /100 | #254 | Tragic 14.3% |
| Immigrants | Ecuador | 0.1 /100 | #255 | Tragic 14.3% |
| Mexican American Indians | 0.1 /100 | #256 | Tragic 14.3% |
| Trinidadians and Tobagonians | 0.1 /100 | #257 | Tragic 14.3% |
| Ottawa | 0.1 /100 | #258 | Tragic 14.3% |
| Immigrants | Nicaragua | 0.1 /100 | #259 | Tragic 14.3% |
| Cape Verdeans | 0.1 /100 | #260 | Tragic 14.4% |
| Cherokee | 0.1 /100 | #261 | Tragic 14.4% |
| Immigrants | Liberia | 0.1 /100 | #262 | Tragic 14.4% |
| Jamaicans | 0.1 /100 | #263 | Tragic 14.4% |
| Immigrants | Jamaica | 0.1 /100 | #264 | Tragic 14.4% |
| Immigrants | Guyana | 0.1 /100 | #265 | Tragic 14.5% |
| Guyanese | 0.1 /100 | #266 | Tragic 14.5% |
| Iroquois | 0.1 /100 | #267 | Tragic 14.5% |
| Sub-Saharan Africans | 0.1 /100 | #268 | Tragic 14.5% |
Demographics Similar to Immigrants from Jordan by Poverty
In terms of poverty, the demographic groups most similar to Immigrants from Jordan are Pakistani (11.9%, a difference of 0.030%), Immigrants from Switzerland (11.8%, a difference of 0.11%), Immigrants from Peru (11.9%, a difference of 0.22%), Immigrants from France (11.9%, a difference of 0.31%), and Chilean (11.8%, a difference of 0.32%).
| Demographics | Rating | Rank | Poverty |
| French | 86.1 /100 | #131 | Excellent 11.8% |
| Peruvians | 85.6 /100 | #132 | Excellent 11.8% |
| Immigrants | Western Europe | 85.2 /100 | #133 | Excellent 11.8% |
| Yugoslavians | 85.2 /100 | #134 | Excellent 11.8% |
| Immigrants | Vietnam | 85.2 /100 | #135 | Excellent 11.8% |
| Chileans | 84.2 /100 | #136 | Excellent 11.8% |
| Immigrants | Switzerland | 83.0 /100 | #137 | Excellent 11.8% |
| Immigrants | Jordan | 82.4 /100 | #138 | Excellent 11.9% |
| Pakistanis | 82.2 /100 | #139 | Excellent 11.9% |
| Immigrants | Peru | 81.1 /100 | #140 | Excellent 11.9% |
| Immigrants | France | 80.5 /100 | #141 | Excellent 11.9% |
| Basques | 80.4 /100 | #142 | Excellent 11.9% |
| Brazilians | 79.7 /100 | #143 | Good 11.9% |
| Icelanders | 77.9 /100 | #144 | Good 11.9% |
| Syrians | 75.1 /100 | #145 | Good 12.0% |