Central American Indian vs Immigrants from Honduras Female Poverty Among 18-24 Year Olds
COMPARE
Central American Indian
Immigrants from Honduras
Female Poverty Among 18-24 Year Olds
Female Poverty Among 18-24 Year Olds Comparison
Central American Indians
Immigrants from Honduras
22.6%
FEMALE POVERTY AMONG 18-24 YEAR OLDS
0.0/ 100
METRIC RATING
298th/ 347
METRIC RANK
21.8%
FEMALE POVERTY AMONG 18-24 YEAR OLDS
0.1/ 100
METRIC RATING
274th/ 347
METRIC RANK
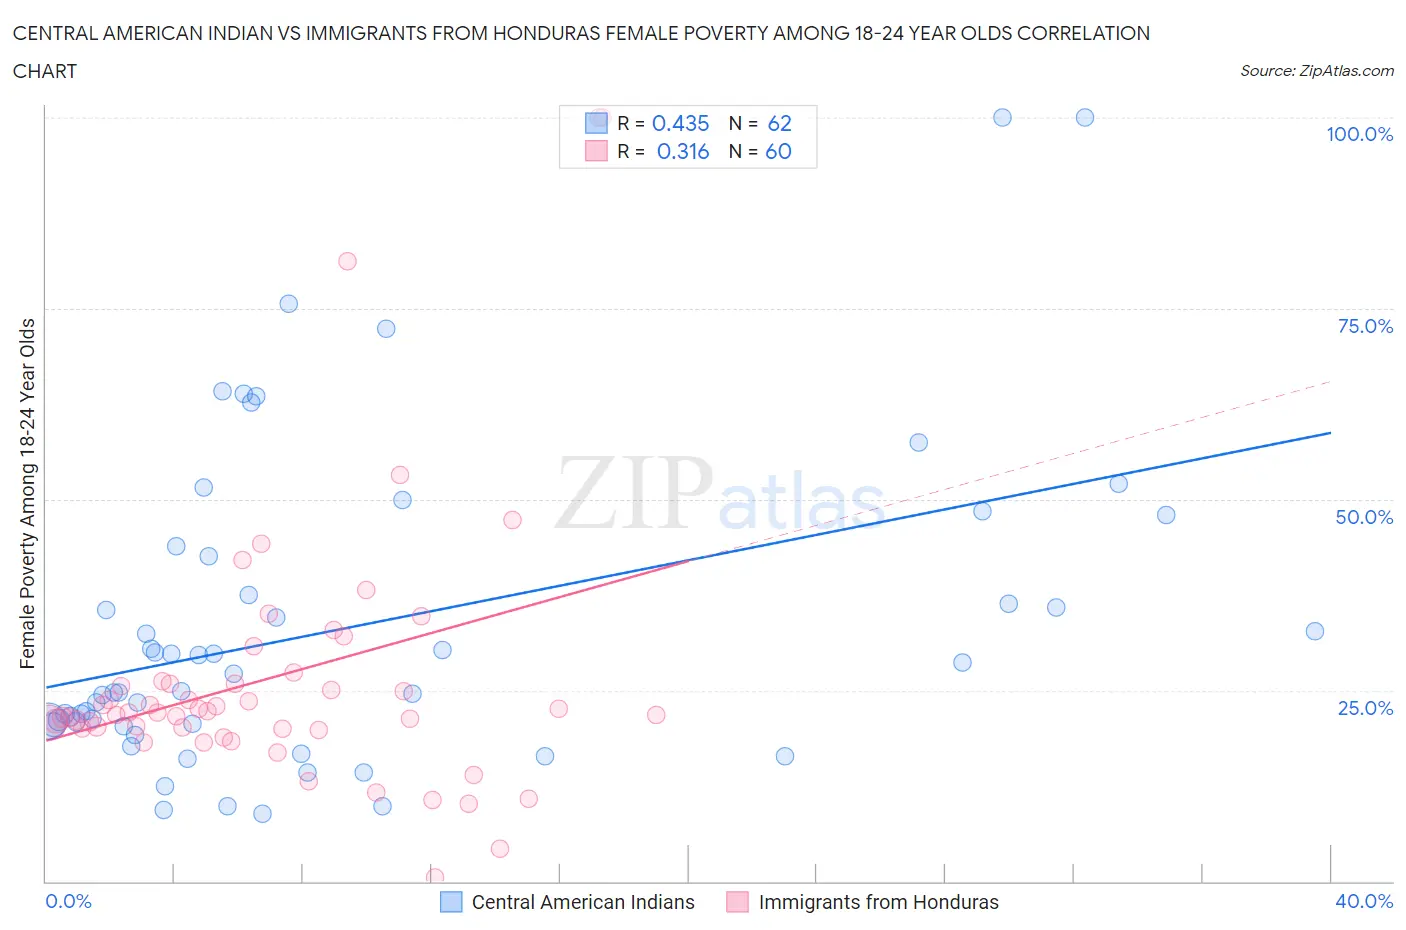
Central American Indian vs Immigrants from Honduras Female Poverty Among 18-24 Year Olds Correlation Chart
The statistical analysis conducted on geographies consisting of 322,009,816 people shows a moderate positive correlation between the proportion of Central American Indians and poverty level among females between the ages 18 and 24 in the United States with a correlation coefficient (R) of 0.435 and weighted average of 22.6%. Similarly, the statistical analysis conducted on geographies consisting of 318,109,471 people shows a mild positive correlation between the proportion of Immigrants from Honduras and poverty level among females between the ages 18 and 24 in the United States with a correlation coefficient (R) of 0.316 and weighted average of 21.8%, a difference of 3.7%.
Female Poverty Among 18-24 Year Olds Correlation Summary
| Measurement | Central American Indian | Immigrants from Honduras |
| Minimum | 8.8% | 0.50% |
| Maximum | 100.0% | 100.0% |
| Range | 91.2% | 99.5% |
| Mean | 33.2% | 26.7% |
| Median | 26.0% | 22.0% |
| Interquartile 25% (IQ1) | 20.6% | 20.0% |
| Interquartile 75% (IQ3) | 42.6% | 26.0% |
| Interquartile Range (IQR) | 22.0% | 6.0% |
| Standard Deviation (Sample) | 20.4% | 18.1% |
| Standard Deviation (Population) | 20.3% | 18.0% |
Similar Demographics by Female Poverty Among 18-24 Year Olds
Demographics Similar to Central American Indians by Female Poverty Among 18-24 Year Olds
In terms of female poverty among 18-24 year olds, the demographic groups most similar to Central American Indians are Inupiat (22.6%, a difference of 0.070%), Menominee (22.5%, a difference of 0.21%), Shoshone (22.5%, a difference of 0.32%), Cherokee (22.7%, a difference of 0.41%), and Indonesian (22.5%, a difference of 0.44%).
| Demographics | Rating | Rank | Female Poverty Among 18-24 Year Olds |
| Bangladeshis | 0.0 /100 | #291 | Tragic 22.5% |
| Alaskan Athabascans | 0.0 /100 | #292 | Tragic 22.5% |
| U.S. Virgin Islanders | 0.0 /100 | #293 | Tragic 22.5% |
| Indonesians | 0.0 /100 | #294 | Tragic 22.5% |
| Shoshone | 0.0 /100 | #295 | Tragic 22.5% |
| Menominee | 0.0 /100 | #296 | Tragic 22.5% |
| Inupiat | 0.0 /100 | #297 | Tragic 22.6% |
| Central American Indians | 0.0 /100 | #298 | Tragic 22.6% |
| Cherokee | 0.0 /100 | #299 | Tragic 22.7% |
| Africans | 0.0 /100 | #300 | Tragic 22.8% |
| Seminole | 0.0 /100 | #301 | Tragic 22.9% |
| Iroquois | 0.0 /100 | #302 | Tragic 22.9% |
| Senegalese | 0.0 /100 | #303 | Tragic 23.0% |
| Sudanese | 0.0 /100 | #304 | Tragic 23.0% |
| Immigrants | Kuwait | 0.0 /100 | #305 | Tragic 23.0% |
Demographics Similar to Immigrants from Honduras by Female Poverty Among 18-24 Year Olds
In terms of female poverty among 18-24 year olds, the demographic groups most similar to Immigrants from Honduras are Immigrants from Bangladesh (21.8%, a difference of 0.040%), Bahamian (21.8%, a difference of 0.060%), Immigrants from Switzerland (21.8%, a difference of 0.19%), New Zealander (21.7%, a difference of 0.39%), and Yaqui (21.9%, a difference of 0.46%).
| Demographics | Rating | Rank | Female Poverty Among 18-24 Year Olds |
| Americans | 0.3 /100 | #267 | Tragic 21.6% |
| Immigrants | Burma/Myanmar | 0.2 /100 | #268 | Tragic 21.6% |
| Celtics | 0.2 /100 | #269 | Tragic 21.6% |
| Mongolians | 0.2 /100 | #270 | Tragic 21.6% |
| Scotch-Irish | 0.2 /100 | #271 | Tragic 21.6% |
| Basques | 0.2 /100 | #272 | Tragic 21.7% |
| New Zealanders | 0.2 /100 | #273 | Tragic 21.7% |
| Immigrants | Honduras | 0.1 /100 | #274 | Tragic 21.8% |
| Immigrants | Bangladesh | 0.1 /100 | #275 | Tragic 21.8% |
| Bahamians | 0.1 /100 | #276 | Tragic 21.8% |
| Immigrants | Switzerland | 0.1 /100 | #277 | Tragic 21.8% |
| Yaqui | 0.1 /100 | #278 | Tragic 21.9% |
| Spanish Americans | 0.1 /100 | #279 | Tragic 21.9% |
| Immigrants | Dominica | 0.1 /100 | #280 | Tragic 21.9% |
| Immigrants | Dominican Republic | 0.1 /100 | #281 | Tragic 21.9% |