Nicaraguan vs Immigrants from Honduras Female Poverty Among 18-24 Year Olds
COMPARE
Nicaraguan
Immigrants from Honduras
Female Poverty Among 18-24 Year Olds
Female Poverty Among 18-24 Year Olds Comparison
Nicaraguans
Immigrants from Honduras
18.1%
FEMALE POVERTY AMONG 18-24 YEAR OLDS
100.0/ 100
METRIC RATING
44th/ 347
METRIC RANK
21.8%
FEMALE POVERTY AMONG 18-24 YEAR OLDS
0.1/ 100
METRIC RATING
274th/ 347
METRIC RANK
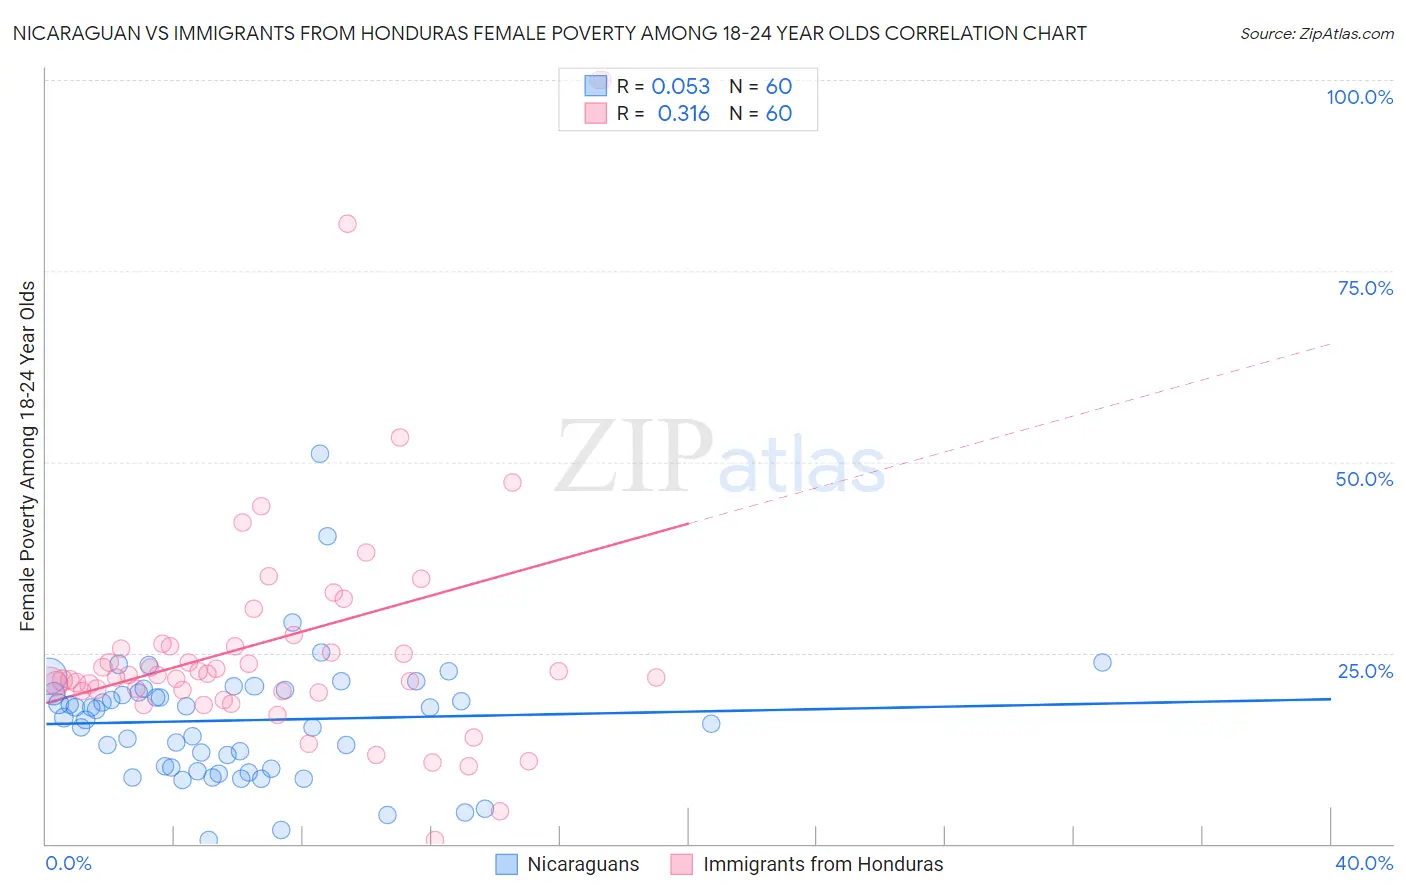
Nicaraguan vs Immigrants from Honduras Female Poverty Among 18-24 Year Olds Correlation Chart
The statistical analysis conducted on geographies consisting of 282,283,725 people shows a slight positive correlation between the proportion of Nicaraguans and poverty level among females between the ages 18 and 24 in the United States with a correlation coefficient (R) of 0.053 and weighted average of 18.1%. Similarly, the statistical analysis conducted on geographies consisting of 318,109,471 people shows a mild positive correlation between the proportion of Immigrants from Honduras and poverty level among females between the ages 18 and 24 in the United States with a correlation coefficient (R) of 0.316 and weighted average of 21.8%, a difference of 20.3%.
Female Poverty Among 18-24 Year Olds Correlation Summary
| Measurement | Nicaraguan | Immigrants from Honduras |
| Minimum | 0.55% | 0.50% |
| Maximum | 51.1% | 100.0% |
| Range | 50.6% | 99.5% |
| Mean | 16.2% | 26.7% |
| Median | 17.1% | 22.0% |
| Interquartile 25% (IQ1) | 9.9% | 20.0% |
| Interquartile 75% (IQ3) | 19.9% | 26.0% |
| Interquartile Range (IQR) | 10.1% | 6.0% |
| Standard Deviation (Sample) | 8.3% | 18.1% |
| Standard Deviation (Population) | 8.3% | 18.0% |
Similar Demographics by Female Poverty Among 18-24 Year Olds
Demographics Similar to Nicaraguans by Female Poverty Among 18-24 Year Olds
In terms of female poverty among 18-24 year olds, the demographic groups most similar to Nicaraguans are Macedonian (18.1%, a difference of 0.080%), Bulgarian (18.1%, a difference of 0.090%), Spanish American Indian (18.1%, a difference of 0.090%), Immigrants from Southern Europe (18.2%, a difference of 0.38%), and Asian (18.2%, a difference of 0.46%).
| Demographics | Rating | Rank | Female Poverty Among 18-24 Year Olds |
| Immigrants | Croatia | 100.0 /100 | #37 | Exceptional 17.9% |
| South Americans | 100.0 /100 | #38 | Exceptional 18.0% |
| Puget Sound Salish | 100.0 /100 | #39 | Exceptional 18.0% |
| Immigrants | Romania | 100.0 /100 | #40 | Exceptional 18.0% |
| Immigrants | Argentina | 100.0 /100 | #41 | Exceptional 18.0% |
| Bulgarians | 100.0 /100 | #42 | Exceptional 18.1% |
| Macedonians | 100.0 /100 | #43 | Exceptional 18.1% |
| Nicaraguans | 100.0 /100 | #44 | Exceptional 18.1% |
| Spanish American Indians | 100.0 /100 | #45 | Exceptional 18.1% |
| Immigrants | Southern Europe | 100.0 /100 | #46 | Exceptional 18.2% |
| Asians | 100.0 /100 | #47 | Exceptional 18.2% |
| Sri Lankans | 100.0 /100 | #48 | Exceptional 18.2% |
| Bhutanese | 100.0 /100 | #49 | Exceptional 18.2% |
| Samoans | 100.0 /100 | #50 | Exceptional 18.2% |
| Immigrants | Eastern Europe | 99.9 /100 | #51 | Exceptional 18.2% |
Demographics Similar to Immigrants from Honduras by Female Poverty Among 18-24 Year Olds
In terms of female poverty among 18-24 year olds, the demographic groups most similar to Immigrants from Honduras are Immigrants from Bangladesh (21.8%, a difference of 0.040%), Bahamian (21.8%, a difference of 0.060%), Immigrants from Switzerland (21.8%, a difference of 0.19%), New Zealander (21.7%, a difference of 0.39%), and Yaqui (21.9%, a difference of 0.46%).
| Demographics | Rating | Rank | Female Poverty Among 18-24 Year Olds |
| Americans | 0.3 /100 | #267 | Tragic 21.6% |
| Immigrants | Burma/Myanmar | 0.2 /100 | #268 | Tragic 21.6% |
| Celtics | 0.2 /100 | #269 | Tragic 21.6% |
| Mongolians | 0.2 /100 | #270 | Tragic 21.6% |
| Scotch-Irish | 0.2 /100 | #271 | Tragic 21.6% |
| Basques | 0.2 /100 | #272 | Tragic 21.7% |
| New Zealanders | 0.2 /100 | #273 | Tragic 21.7% |
| Immigrants | Honduras | 0.1 /100 | #274 | Tragic 21.8% |
| Immigrants | Bangladesh | 0.1 /100 | #275 | Tragic 21.8% |
| Bahamians | 0.1 /100 | #276 | Tragic 21.8% |
| Immigrants | Switzerland | 0.1 /100 | #277 | Tragic 21.8% |
| Yaqui | 0.1 /100 | #278 | Tragic 21.9% |
| Spanish Americans | 0.1 /100 | #279 | Tragic 21.9% |
| Immigrants | Dominica | 0.1 /100 | #280 | Tragic 21.9% |
| Immigrants | Dominican Republic | 0.1 /100 | #281 | Tragic 21.9% |