Central American Indian vs Immigrants from Honduras Currently Married
COMPARE
Central American Indian
Immigrants from Honduras
Currently Married
Currently Married Comparison
Central American Indians
Immigrants from Honduras
43.3%
CURRENTLY MARRIED
0.0/ 100
METRIC RATING
279th/ 347
METRIC RANK
42.2%
CURRENTLY MARRIED
0.0/ 100
METRIC RATING
298th/ 347
METRIC RANK
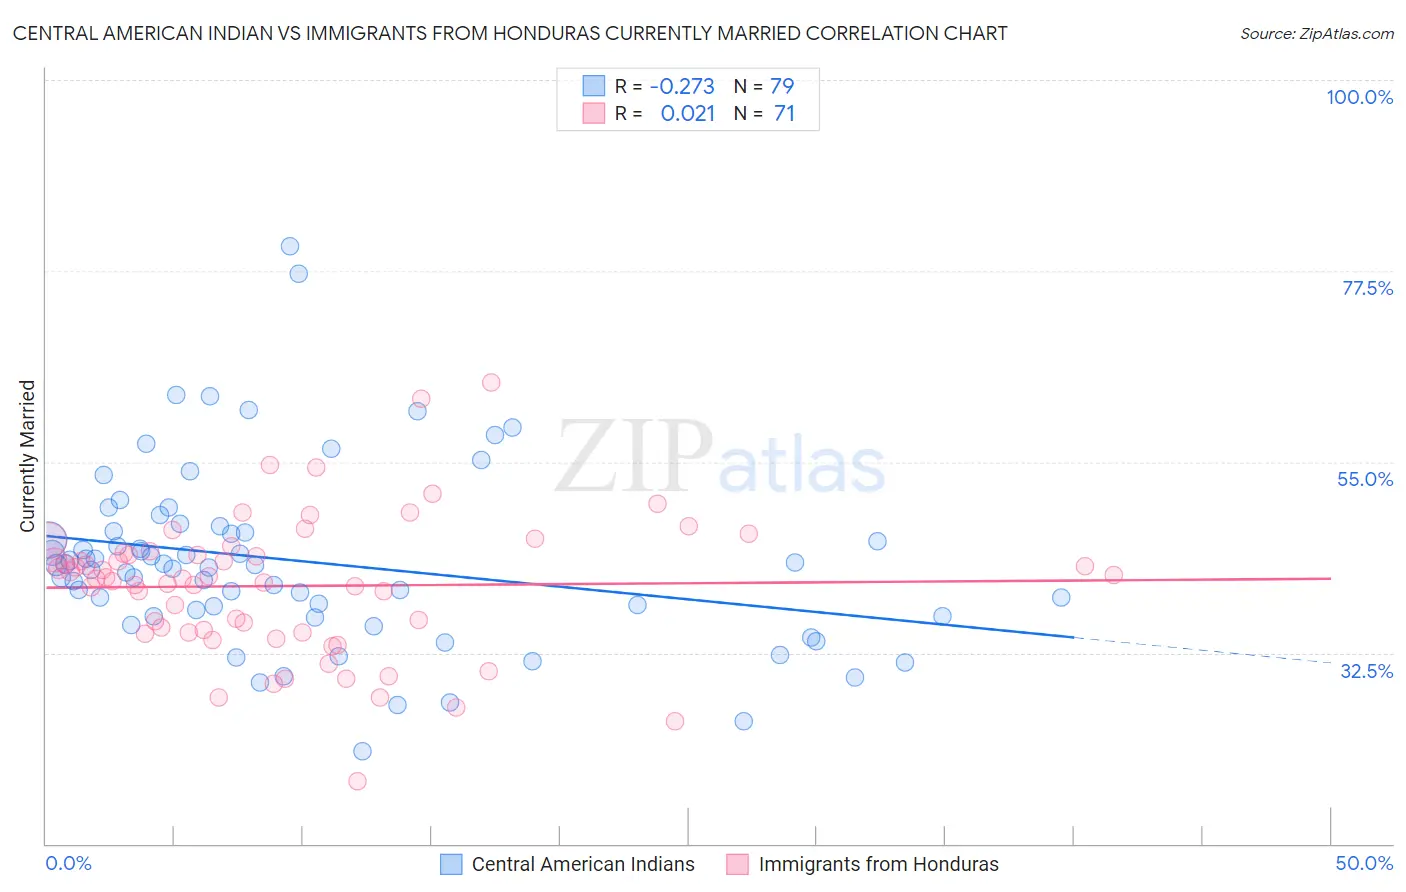
Central American Indian vs Immigrants from Honduras Currently Married Correlation Chart
The statistical analysis conducted on geographies consisting of 326,134,160 people shows a weak negative correlation between the proportion of Central American Indians and percentage of population currently married in the United States with a correlation coefficient (R) of -0.273 and weighted average of 43.3%. Similarly, the statistical analysis conducted on geographies consisting of 322,599,872 people shows no correlation between the proportion of Immigrants from Honduras and percentage of population currently married in the United States with a correlation coefficient (R) of 0.021 and weighted average of 42.2%, a difference of 2.5%.
Currently Married Correlation Summary
| Measurement | Central American Indian | Immigrants from Honduras |
| Minimum | 20.9% | 17.3% |
| Maximum | 80.4% | 64.4% |
| Range | 59.5% | 47.1% |
| Mean | 43.3% | 40.4% |
| Median | 42.8% | 41.2% |
| Interquartile 25% (IQ1) | 36.8% | 34.9% |
| Interquartile 75% (IQ3) | 46.8% | 44.3% |
| Interquartile Range (IQR) | 10.0% | 9.3% |
| Standard Deviation (Sample) | 10.6% | 8.2% |
| Standard Deviation (Population) | 10.5% | 8.1% |
Demographics Similar to Central American Indians and Immigrants from Honduras by Currently Married
In terms of currently married, the demographic groups most similar to Central American Indians are Apache (43.2%, a difference of 0.080%), Chippewa (43.2%, a difference of 0.080%), Central American (43.3%, a difference of 0.15%), Immigrants from Ecuador (43.2%, a difference of 0.16%), and Kiowa (43.2%, a difference of 0.27%). Similarly, the demographic groups most similar to Immigrants from Honduras are Cheyenne (42.2%, a difference of 0.090%), Menominee (42.3%, a difference of 0.20%), Immigrants from Western Africa (42.4%, a difference of 0.40%), Honduran (42.5%, a difference of 0.74%), and Yuman (42.6%, a difference of 0.86%).
| Demographics | Rating | Rank | Currently Married |
| Central Americans | 0.0 /100 | #278 | Tragic 43.3% |
| Central American Indians | 0.0 /100 | #279 | Tragic 43.3% |
| Apache | 0.0 /100 | #280 | Tragic 43.2% |
| Chippewa | 0.0 /100 | #281 | Tragic 43.2% |
| Immigrants | Ecuador | 0.0 /100 | #282 | Tragic 43.2% |
| Kiowa | 0.0 /100 | #283 | Tragic 43.2% |
| Immigrants | El Salvador | 0.0 /100 | #284 | Tragic 43.1% |
| Immigrants | Middle Africa | 0.0 /100 | #285 | Tragic 43.0% |
| Ghanaians | 0.0 /100 | #286 | Tragic 42.9% |
| Guatemalans | 0.0 /100 | #287 | Tragic 42.9% |
| Natives/Alaskans | 0.0 /100 | #288 | Tragic 42.8% |
| Paiute | 0.0 /100 | #289 | Tragic 42.7% |
| Immigrants | Ghana | 0.0 /100 | #290 | Tragic 42.7% |
| Immigrants | Guatemala | 0.0 /100 | #291 | Tragic 42.6% |
| Sub-Saharan Africans | 0.0 /100 | #292 | Tragic 42.6% |
| Yuman | 0.0 /100 | #293 | Tragic 42.6% |
| Hondurans | 0.0 /100 | #294 | Tragic 42.5% |
| Immigrants | Western Africa | 0.0 /100 | #295 | Tragic 42.4% |
| Menominee | 0.0 /100 | #296 | Tragic 42.3% |
| Cheyenne | 0.0 /100 | #297 | Tragic 42.2% |
| Immigrants | Honduras | 0.0 /100 | #298 | Tragic 42.2% |