Black/African American vs Immigrants from Honduras Female Poverty Among 18-24 Year Olds
COMPARE
Black/African American
Immigrants from Honduras
Female Poverty Among 18-24 Year Olds
Female Poverty Among 18-24 Year Olds Comparison
Blacks/African Americans
Immigrants from Honduras
24.3%
FEMALE POVERTY AMONG 18-24 YEAR OLDS
0.0/ 100
METRIC RATING
315th/ 347
METRIC RANK
21.8%
FEMALE POVERTY AMONG 18-24 YEAR OLDS
0.1/ 100
METRIC RATING
274th/ 347
METRIC RANK
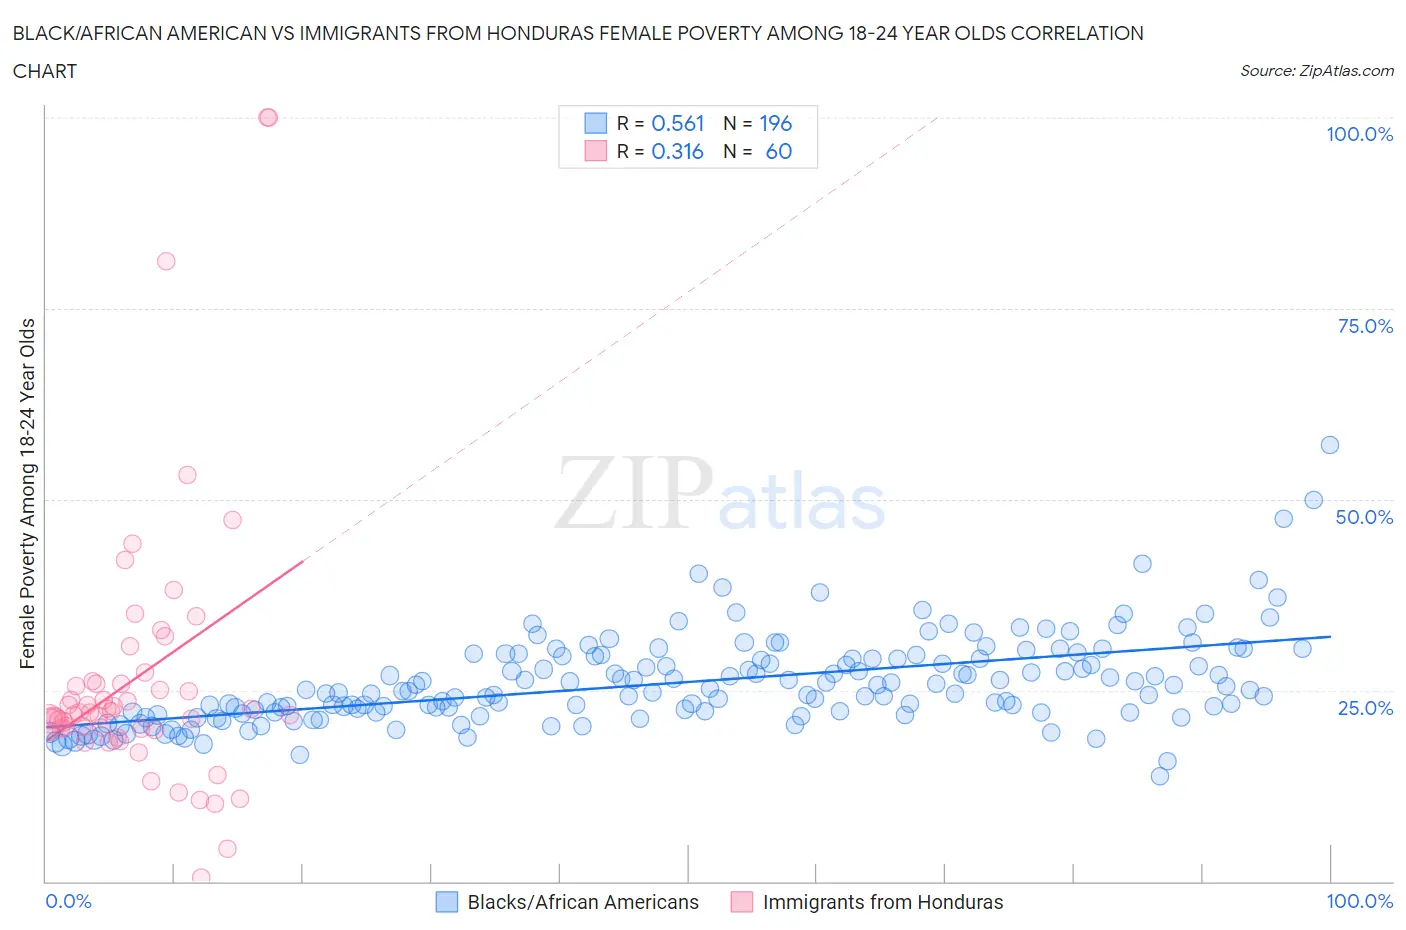
Black/African American vs Immigrants from Honduras Female Poverty Among 18-24 Year Olds Correlation Chart
The statistical analysis conducted on geographies consisting of 536,191,091 people shows a substantial positive correlation between the proportion of Blacks/African Americans and poverty level among females between the ages 18 and 24 in the United States with a correlation coefficient (R) of 0.561 and weighted average of 24.3%. Similarly, the statistical analysis conducted on geographies consisting of 318,109,471 people shows a mild positive correlation between the proportion of Immigrants from Honduras and poverty level among females between the ages 18 and 24 in the United States with a correlation coefficient (R) of 0.316 and weighted average of 21.8%, a difference of 11.6%.
Female Poverty Among 18-24 Year Olds Correlation Summary
| Measurement | Black/African American | Immigrants from Honduras |
| Minimum | 13.7% | 0.50% |
| Maximum | 57.1% | 100.0% |
| Range | 43.4% | 99.5% |
| Mean | 26.0% | 26.7% |
| Median | 24.8% | 22.0% |
| Interquartile 25% (IQ1) | 22.0% | 20.0% |
| Interquartile 75% (IQ3) | 29.2% | 26.0% |
| Interquartile Range (IQR) | 7.2% | 6.0% |
| Standard Deviation (Sample) | 6.0% | 18.1% |
| Standard Deviation (Population) | 6.0% | 18.0% |
Similar Demographics by Female Poverty Among 18-24 Year Olds
Demographics Similar to Blacks/African Americans by Female Poverty Among 18-24 Year Olds
In terms of female poverty among 18-24 year olds, the demographic groups most similar to Blacks/African Americans are Choctaw (24.3%, a difference of 0.20%), Alsatian (24.4%, a difference of 0.31%), Creek (24.2%, a difference of 0.36%), Osage (24.5%, a difference of 0.60%), and Chickasaw (24.5%, a difference of 0.69%).
| Demographics | Rating | Rank | Female Poverty Among 18-24 Year Olds |
| Immigrants | Sudan | 0.0 /100 | #308 | Tragic 23.5% |
| Blackfeet | 0.0 /100 | #309 | Tragic 23.6% |
| Comanche | 0.0 /100 | #310 | Tragic 23.6% |
| Potawatomi | 0.0 /100 | #311 | Tragic 23.7% |
| Yuman | 0.0 /100 | #312 | Tragic 24.0% |
| Creek | 0.0 /100 | #313 | Tragic 24.2% |
| Choctaw | 0.0 /100 | #314 | Tragic 24.3% |
| Blacks/African Americans | 0.0 /100 | #315 | Tragic 24.3% |
| Alsatians | 0.0 /100 | #316 | Tragic 24.4% |
| Osage | 0.0 /100 | #317 | Tragic 24.5% |
| Chickasaw | 0.0 /100 | #318 | Tragic 24.5% |
| Dutch West Indians | 0.0 /100 | #319 | Tragic 24.5% |
| Immigrants | Congo | 0.0 /100 | #320 | Tragic 24.6% |
| Immigrants | Zaire | 0.0 /100 | #321 | Tragic 25.1% |
| Somalis | 0.0 /100 | #322 | Tragic 25.1% |
Demographics Similar to Immigrants from Honduras by Female Poverty Among 18-24 Year Olds
In terms of female poverty among 18-24 year olds, the demographic groups most similar to Immigrants from Honduras are Immigrants from Bangladesh (21.8%, a difference of 0.040%), Bahamian (21.8%, a difference of 0.060%), Immigrants from Switzerland (21.8%, a difference of 0.19%), New Zealander (21.7%, a difference of 0.39%), and Yaqui (21.9%, a difference of 0.46%).
| Demographics | Rating | Rank | Female Poverty Among 18-24 Year Olds |
| Americans | 0.3 /100 | #267 | Tragic 21.6% |
| Immigrants | Burma/Myanmar | 0.2 /100 | #268 | Tragic 21.6% |
| Celtics | 0.2 /100 | #269 | Tragic 21.6% |
| Mongolians | 0.2 /100 | #270 | Tragic 21.6% |
| Scotch-Irish | 0.2 /100 | #271 | Tragic 21.6% |
| Basques | 0.2 /100 | #272 | Tragic 21.7% |
| New Zealanders | 0.2 /100 | #273 | Tragic 21.7% |
| Immigrants | Honduras | 0.1 /100 | #274 | Tragic 21.8% |
| Immigrants | Bangladesh | 0.1 /100 | #275 | Tragic 21.8% |
| Bahamians | 0.1 /100 | #276 | Tragic 21.8% |
| Immigrants | Switzerland | 0.1 /100 | #277 | Tragic 21.8% |
| Yaqui | 0.1 /100 | #278 | Tragic 21.9% |
| Spanish Americans | 0.1 /100 | #279 | Tragic 21.9% |
| Immigrants | Dominica | 0.1 /100 | #280 | Tragic 21.9% |
| Immigrants | Dominican Republic | 0.1 /100 | #281 | Tragic 21.9% |