Arab vs Immigrants from Honduras Female Poverty Among 18-24 Year Olds
COMPARE
Arab
Immigrants from Honduras
Female Poverty Among 18-24 Year Olds
Female Poverty Among 18-24 Year Olds Comparison
Arabs
Immigrants from Honduras
20.5%
FEMALE POVERTY AMONG 18-24 YEAR OLDS
15.5/ 100
METRIC RATING
209th/ 347
METRIC RANK
21.8%
FEMALE POVERTY AMONG 18-24 YEAR OLDS
0.1/ 100
METRIC RATING
274th/ 347
METRIC RANK
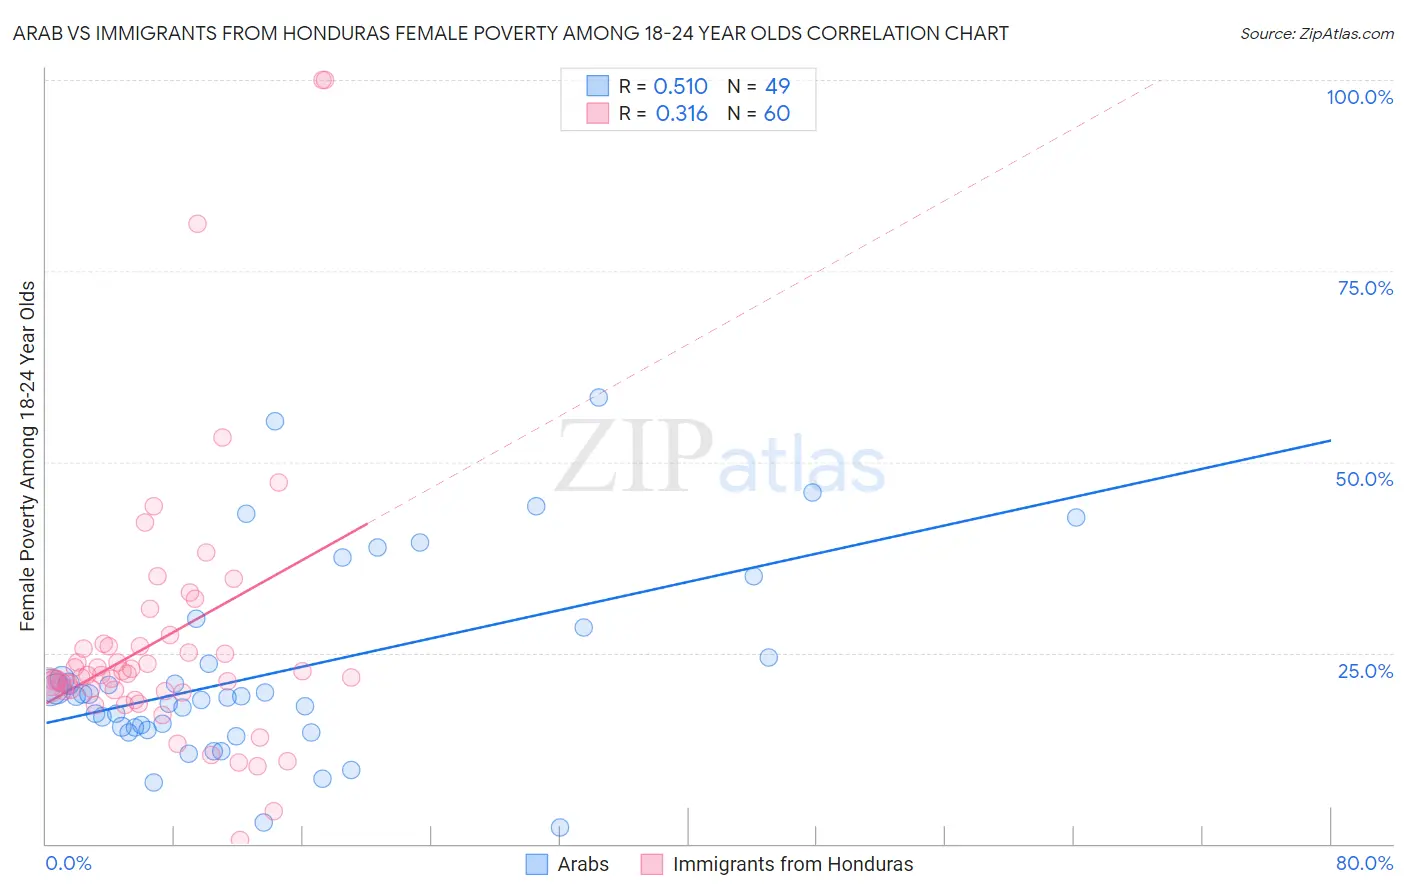
Arab vs Immigrants from Honduras Female Poverty Among 18-24 Year Olds Correlation Chart
The statistical analysis conducted on geographies consisting of 469,243,269 people shows a substantial positive correlation between the proportion of Arabs and poverty level among females between the ages 18 and 24 in the United States with a correlation coefficient (R) of 0.510 and weighted average of 20.5%. Similarly, the statistical analysis conducted on geographies consisting of 318,109,471 people shows a mild positive correlation between the proportion of Immigrants from Honduras and poverty level among females between the ages 18 and 24 in the United States with a correlation coefficient (R) of 0.316 and weighted average of 21.8%, a difference of 6.1%.
Female Poverty Among 18-24 Year Olds Correlation Summary
| Measurement | Arab | Immigrants from Honduras |
| Minimum | 2.1% | 0.50% |
| Maximum | 58.5% | 100.0% |
| Range | 56.4% | 99.5% |
| Mean | 22.4% | 26.7% |
| Median | 19.3% | 22.0% |
| Interquartile 25% (IQ1) | 15.0% | 20.0% |
| Interquartile 75% (IQ3) | 26.3% | 26.0% |
| Interquartile Range (IQR) | 11.3% | 6.0% |
| Standard Deviation (Sample) | 12.6% | 18.1% |
| Standard Deviation (Population) | 12.5% | 18.0% |
Similar Demographics by Female Poverty Among 18-24 Year Olds
Demographics Similar to Arabs by Female Poverty Among 18-24 Year Olds
In terms of female poverty among 18-24 year olds, the demographic groups most similar to Arabs are Dutch (20.5%, a difference of 0.030%), Spaniard (20.5%, a difference of 0.070%), English (20.5%, a difference of 0.10%), Hispanic or Latino (20.5%, a difference of 0.10%), and Immigrants from Ghana (20.5%, a difference of 0.11%).
| Demographics | Rating | Rank | Female Poverty Among 18-24 Year Olds |
| Immigrants | Turkey | 17.7 /100 | #202 | Poor 20.5% |
| Immigrants | Malaysia | 17.2 /100 | #203 | Poor 20.5% |
| Immigrants | Netherlands | 17.0 /100 | #204 | Poor 20.5% |
| English | 16.7 /100 | #205 | Poor 20.5% |
| Hispanics or Latinos | 16.6 /100 | #206 | Poor 20.5% |
| Spaniards | 16.3 /100 | #207 | Poor 20.5% |
| Dutch | 15.9 /100 | #208 | Poor 20.5% |
| Arabs | 15.5 /100 | #209 | Poor 20.5% |
| Immigrants | Ghana | 14.3 /100 | #210 | Poor 20.5% |
| Immigrants | Western Europe | 13.5 /100 | #211 | Poor 20.6% |
| Liberians | 11.6 /100 | #212 | Poor 20.6% |
| Northern Europeans | 11.6 /100 | #213 | Poor 20.6% |
| Immigrants | South Africa | 10.7 /100 | #214 | Poor 20.6% |
| Spanish | 10.4 /100 | #215 | Poor 20.6% |
| Immigrants | Western Africa | 10.2 /100 | #216 | Poor 20.6% |
Demographics Similar to Immigrants from Honduras by Female Poverty Among 18-24 Year Olds
In terms of female poverty among 18-24 year olds, the demographic groups most similar to Immigrants from Honduras are Immigrants from Bangladesh (21.8%, a difference of 0.040%), Bahamian (21.8%, a difference of 0.060%), Immigrants from Switzerland (21.8%, a difference of 0.19%), New Zealander (21.7%, a difference of 0.39%), and Yaqui (21.9%, a difference of 0.46%).
| Demographics | Rating | Rank | Female Poverty Among 18-24 Year Olds |
| Americans | 0.3 /100 | #267 | Tragic 21.6% |
| Immigrants | Burma/Myanmar | 0.2 /100 | #268 | Tragic 21.6% |
| Celtics | 0.2 /100 | #269 | Tragic 21.6% |
| Mongolians | 0.2 /100 | #270 | Tragic 21.6% |
| Scotch-Irish | 0.2 /100 | #271 | Tragic 21.6% |
| Basques | 0.2 /100 | #272 | Tragic 21.7% |
| New Zealanders | 0.2 /100 | #273 | Tragic 21.7% |
| Immigrants | Honduras | 0.1 /100 | #274 | Tragic 21.8% |
| Immigrants | Bangladesh | 0.1 /100 | #275 | Tragic 21.8% |
| Bahamians | 0.1 /100 | #276 | Tragic 21.8% |
| Immigrants | Switzerland | 0.1 /100 | #277 | Tragic 21.8% |
| Yaqui | 0.1 /100 | #278 | Tragic 21.9% |
| Spanish Americans | 0.1 /100 | #279 | Tragic 21.9% |
| Immigrants | Dominica | 0.1 /100 | #280 | Tragic 21.9% |
| Immigrants | Dominican Republic | 0.1 /100 | #281 | Tragic 21.9% |