Immigrants from Lebanon vs Immigrants from Honduras Female Poverty Among 18-24 Year Olds
COMPARE
Immigrants from Lebanon
Immigrants from Honduras
Female Poverty Among 18-24 Year Olds
Female Poverty Among 18-24 Year Olds Comparison
Immigrants from Lebanon
Immigrants from Honduras
19.8%
FEMALE POVERTY AMONG 18-24 YEAR OLDS
75.3/ 100
METRIC RATING
158th/ 347
METRIC RANK
21.8%
FEMALE POVERTY AMONG 18-24 YEAR OLDS
0.1/ 100
METRIC RATING
274th/ 347
METRIC RANK
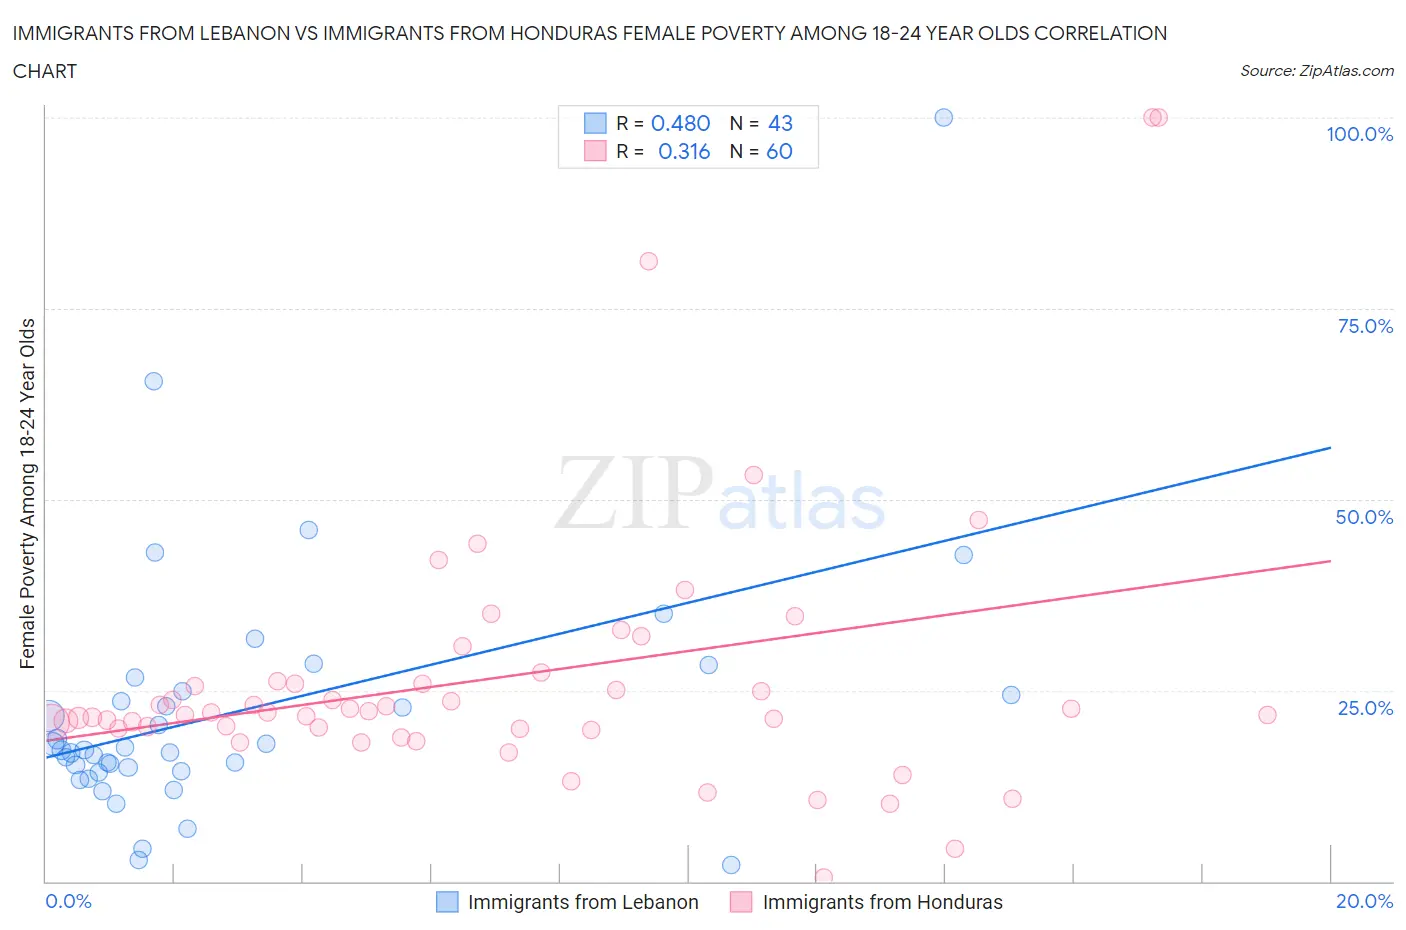
Immigrants from Lebanon vs Immigrants from Honduras Female Poverty Among 18-24 Year Olds Correlation Chart
The statistical analysis conducted on geographies consisting of 214,316,536 people shows a moderate positive correlation between the proportion of Immigrants from Lebanon and poverty level among females between the ages 18 and 24 in the United States with a correlation coefficient (R) of 0.480 and weighted average of 19.8%. Similarly, the statistical analysis conducted on geographies consisting of 318,109,471 people shows a mild positive correlation between the proportion of Immigrants from Honduras and poverty level among females between the ages 18 and 24 in the United States with a correlation coefficient (R) of 0.316 and weighted average of 21.8%, a difference of 9.9%.
Female Poverty Among 18-24 Year Olds Correlation Summary
| Measurement | Immigrants from Lebanon | Immigrants from Honduras |
| Minimum | 2.1% | 0.50% |
| Maximum | 100.0% | 100.0% |
| Range | 97.9% | 99.5% |
| Mean | 22.4% | 26.7% |
| Median | 17.2% | 22.0% |
| Interquartile 25% (IQ1) | 14.4% | 20.0% |
| Interquartile 75% (IQ3) | 24.8% | 26.0% |
| Interquartile Range (IQR) | 10.5% | 6.0% |
| Standard Deviation (Sample) | 17.0% | 18.1% |
| Standard Deviation (Population) | 16.8% | 18.0% |
Similar Demographics by Female Poverty Among 18-24 Year Olds
Demographics Similar to Immigrants from Lebanon by Female Poverty Among 18-24 Year Olds
In terms of female poverty among 18-24 year olds, the demographic groups most similar to Immigrants from Lebanon are Danish (19.8%, a difference of 0.020%), Trinidadian and Tobagonian (19.8%, a difference of 0.060%), Immigrants from Belgium (19.8%, a difference of 0.080%), Pakistani (19.8%, a difference of 0.080%), and Immigrants from Belize (19.8%, a difference of 0.080%).
| Demographics | Rating | Rank | Female Poverty Among 18-24 Year Olds |
| Immigrants | Eastern Asia | 79.7 /100 | #151 | Good 19.8% |
| Yugoslavians | 79.0 /100 | #152 | Good 19.8% |
| Immigrants | Japan | 78.1 /100 | #153 | Good 19.8% |
| Immigrants | Zimbabwe | 76.7 /100 | #154 | Good 19.8% |
| Hungarians | 76.6 /100 | #155 | Good 19.8% |
| Immigrants | Belgium | 76.4 /100 | #156 | Good 19.8% |
| Danes | 75.5 /100 | #157 | Good 19.8% |
| Immigrants | Lebanon | 75.3 /100 | #158 | Good 19.8% |
| Trinidadians and Tobagonians | 74.4 /100 | #159 | Good 19.8% |
| Pakistanis | 74.1 /100 | #160 | Good 19.8% |
| Immigrants | Belize | 74.1 /100 | #161 | Good 19.8% |
| French Canadians | 73.0 /100 | #162 | Good 19.9% |
| Malaysians | 72.7 /100 | #163 | Good 19.9% |
| Central Americans | 70.0 /100 | #164 | Good 19.9% |
| Eastern Europeans | 69.3 /100 | #165 | Good 19.9% |
Demographics Similar to Immigrants from Honduras by Female Poverty Among 18-24 Year Olds
In terms of female poverty among 18-24 year olds, the demographic groups most similar to Immigrants from Honduras are Immigrants from Bangladesh (21.8%, a difference of 0.040%), Bahamian (21.8%, a difference of 0.060%), Immigrants from Switzerland (21.8%, a difference of 0.19%), New Zealander (21.7%, a difference of 0.39%), and Yaqui (21.9%, a difference of 0.46%).
| Demographics | Rating | Rank | Female Poverty Among 18-24 Year Olds |
| Americans | 0.3 /100 | #267 | Tragic 21.6% |
| Immigrants | Burma/Myanmar | 0.2 /100 | #268 | Tragic 21.6% |
| Celtics | 0.2 /100 | #269 | Tragic 21.6% |
| Mongolians | 0.2 /100 | #270 | Tragic 21.6% |
| Scotch-Irish | 0.2 /100 | #271 | Tragic 21.6% |
| Basques | 0.2 /100 | #272 | Tragic 21.7% |
| New Zealanders | 0.2 /100 | #273 | Tragic 21.7% |
| Immigrants | Honduras | 0.1 /100 | #274 | Tragic 21.8% |
| Immigrants | Bangladesh | 0.1 /100 | #275 | Tragic 21.8% |
| Bahamians | 0.1 /100 | #276 | Tragic 21.8% |
| Immigrants | Switzerland | 0.1 /100 | #277 | Tragic 21.8% |
| Yaqui | 0.1 /100 | #278 | Tragic 21.9% |
| Spanish Americans | 0.1 /100 | #279 | Tragic 21.9% |
| Immigrants | Dominica | 0.1 /100 | #280 | Tragic 21.9% |
| Immigrants | Dominican Republic | 0.1 /100 | #281 | Tragic 21.9% |