Central American Indian vs Immigrants from Central America Female Poverty Among 18-24 Year Olds
COMPARE
Central American Indian
Immigrants from Central America
Female Poverty Among 18-24 Year Olds
Female Poverty Among 18-24 Year Olds Comparison
Central American Indians
Immigrants from Central America
22.6%
FEMALE POVERTY AMONG 18-24 YEAR OLDS
0.0/ 100
METRIC RATING
298th/ 347
METRIC RANK
20.2%
FEMALE POVERTY AMONG 18-24 YEAR OLDS
39.9/ 100
METRIC RATING
184th/ 347
METRIC RANK
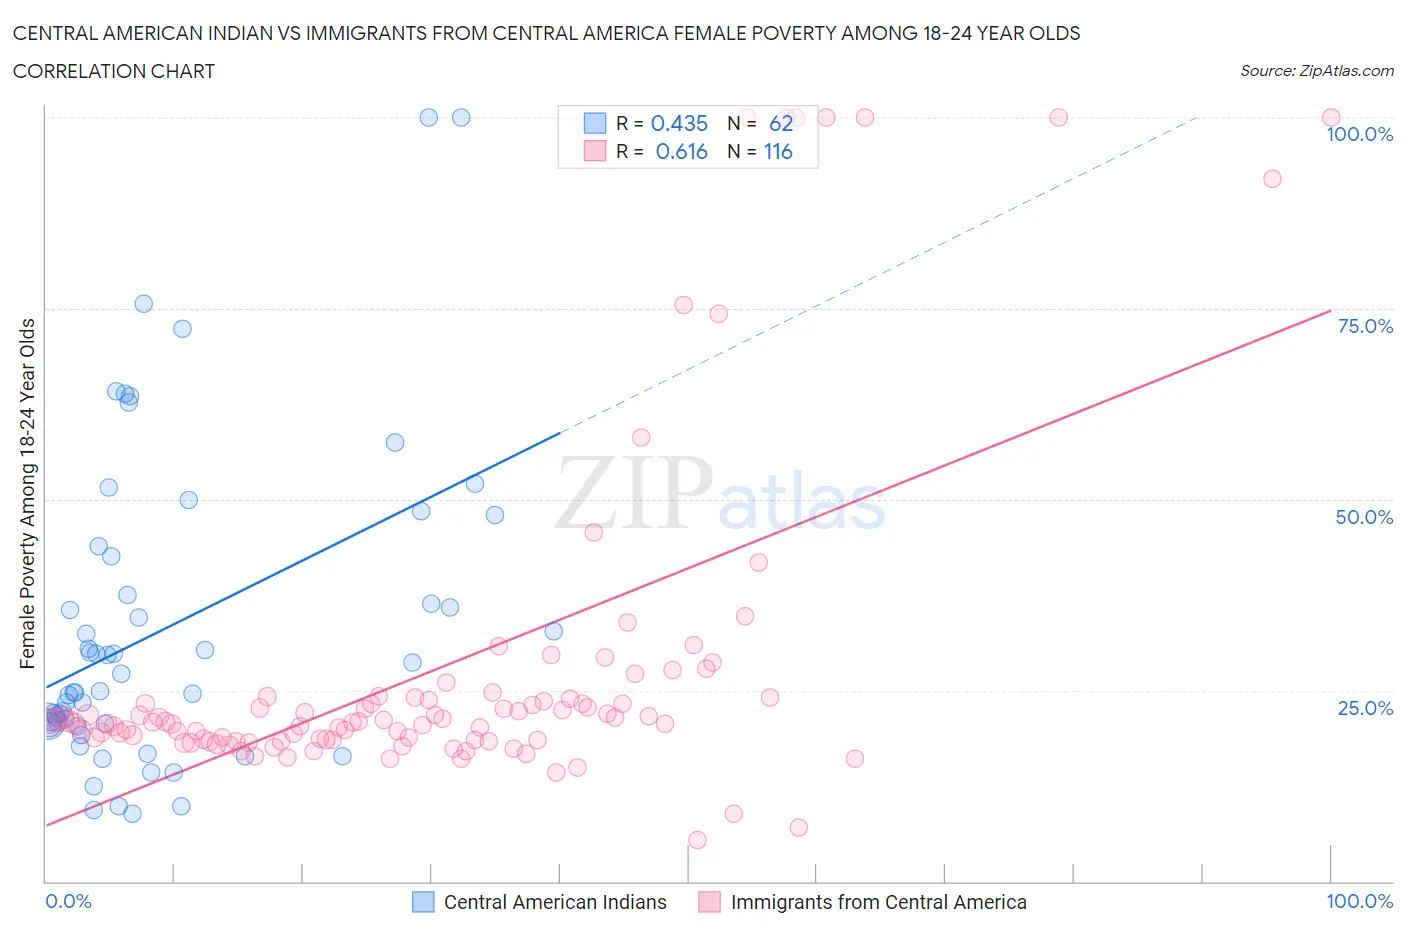
Central American Indian vs Immigrants from Central America Female Poverty Among 18-24 Year Olds Correlation Chart
The statistical analysis conducted on geographies consisting of 322,009,816 people shows a moderate positive correlation between the proportion of Central American Indians and poverty level among females between the ages 18 and 24 in the United States with a correlation coefficient (R) of 0.435 and weighted average of 22.6%. Similarly, the statistical analysis conducted on geographies consisting of 512,946,192 people shows a significant positive correlation between the proportion of Immigrants from Central America and poverty level among females between the ages 18 and 24 in the United States with a correlation coefficient (R) of 0.616 and weighted average of 20.2%, a difference of 11.8%.
Female Poverty Among 18-24 Year Olds Correlation Summary
| Measurement | Central American Indian | Immigrants from Central America |
| Minimum | 8.8% | 5.3% |
| Maximum | 100.0% | 100.0% |
| Range | 91.2% | 94.7% |
| Mean | 33.2% | 27.8% |
| Median | 26.0% | 20.9% |
| Interquartile 25% (IQ1) | 20.6% | 18.6% |
| Interquartile 75% (IQ3) | 42.6% | 23.9% |
| Interquartile Range (IQR) | 22.0% | 5.4% |
| Standard Deviation (Sample) | 20.4% | 21.6% |
| Standard Deviation (Population) | 20.3% | 21.5% |
Similar Demographics by Female Poverty Among 18-24 Year Olds
Demographics Similar to Central American Indians by Female Poverty Among 18-24 Year Olds
In terms of female poverty among 18-24 year olds, the demographic groups most similar to Central American Indians are Inupiat (22.6%, a difference of 0.070%), Menominee (22.5%, a difference of 0.21%), Shoshone (22.5%, a difference of 0.32%), Cherokee (22.7%, a difference of 0.41%), and Indonesian (22.5%, a difference of 0.44%).
| Demographics | Rating | Rank | Female Poverty Among 18-24 Year Olds |
| Bangladeshis | 0.0 /100 | #291 | Tragic 22.5% |
| Alaskan Athabascans | 0.0 /100 | #292 | Tragic 22.5% |
| U.S. Virgin Islanders | 0.0 /100 | #293 | Tragic 22.5% |
| Indonesians | 0.0 /100 | #294 | Tragic 22.5% |
| Shoshone | 0.0 /100 | #295 | Tragic 22.5% |
| Menominee | 0.0 /100 | #296 | Tragic 22.5% |
| Inupiat | 0.0 /100 | #297 | Tragic 22.6% |
| Central American Indians | 0.0 /100 | #298 | Tragic 22.6% |
| Cherokee | 0.0 /100 | #299 | Tragic 22.7% |
| Africans | 0.0 /100 | #300 | Tragic 22.8% |
| Seminole | 0.0 /100 | #301 | Tragic 22.9% |
| Iroquois | 0.0 /100 | #302 | Tragic 22.9% |
| Senegalese | 0.0 /100 | #303 | Tragic 23.0% |
| Sudanese | 0.0 /100 | #304 | Tragic 23.0% |
| Immigrants | Kuwait | 0.0 /100 | #305 | Tragic 23.0% |
Demographics Similar to Immigrants from Central America by Female Poverty Among 18-24 Year Olds
In terms of female poverty among 18-24 year olds, the demographic groups most similar to Immigrants from Central America are Nepalese (20.2%, a difference of 0.010%), Lebanese (20.2%, a difference of 0.030%), Immigrants from Ethiopia (20.2%, a difference of 0.14%), Immigrants from China (20.2%, a difference of 0.15%), and Immigrants from Barbados (20.2%, a difference of 0.15%).
| Demographics | Rating | Rank | Female Poverty Among 18-24 Year Olds |
| Immigrants | Kazakhstan | 44.2 /100 | #177 | Average 20.2% |
| Swiss | 44.0 /100 | #178 | Average 20.2% |
| Ethiopians | 43.8 /100 | #179 | Average 20.2% |
| Iraqis | 43.3 /100 | #180 | Average 20.2% |
| Immigrants | China | 43.0 /100 | #181 | Average 20.2% |
| Immigrants | Barbados | 42.8 /100 | #182 | Average 20.2% |
| Lebanese | 40.6 /100 | #183 | Average 20.2% |
| Immigrants | Central America | 39.9 /100 | #184 | Fair 20.2% |
| Nepalese | 39.7 /100 | #185 | Fair 20.2% |
| Immigrants | Ethiopia | 37.3 /100 | #186 | Fair 20.2% |
| Immigrants | Mexico | 36.3 /100 | #187 | Fair 20.2% |
| Scandinavians | 34.6 /100 | #188 | Fair 20.3% |
| Immigrants | Germany | 34.0 /100 | #189 | Fair 20.3% |
| Immigrants | Western Asia | 29.3 /100 | #190 | Fair 20.3% |
| Moroccans | 25.8 /100 | #191 | Fair 20.4% |