Central American Indian vs Israeli Female Poverty Among 18-24 Year Olds
COMPARE
Central American Indian
Israeli
Female Poverty Among 18-24 Year Olds
Female Poverty Among 18-24 Year Olds Comparison
Central American Indians
Israelis
22.6%
FEMALE POVERTY AMONG 18-24 YEAR OLDS
0.0/ 100
METRIC RATING
298th/ 347
METRIC RANK
20.9%
FEMALE POVERTY AMONG 18-24 YEAR OLDS
4.1/ 100
METRIC RATING
242nd/ 347
METRIC RANK
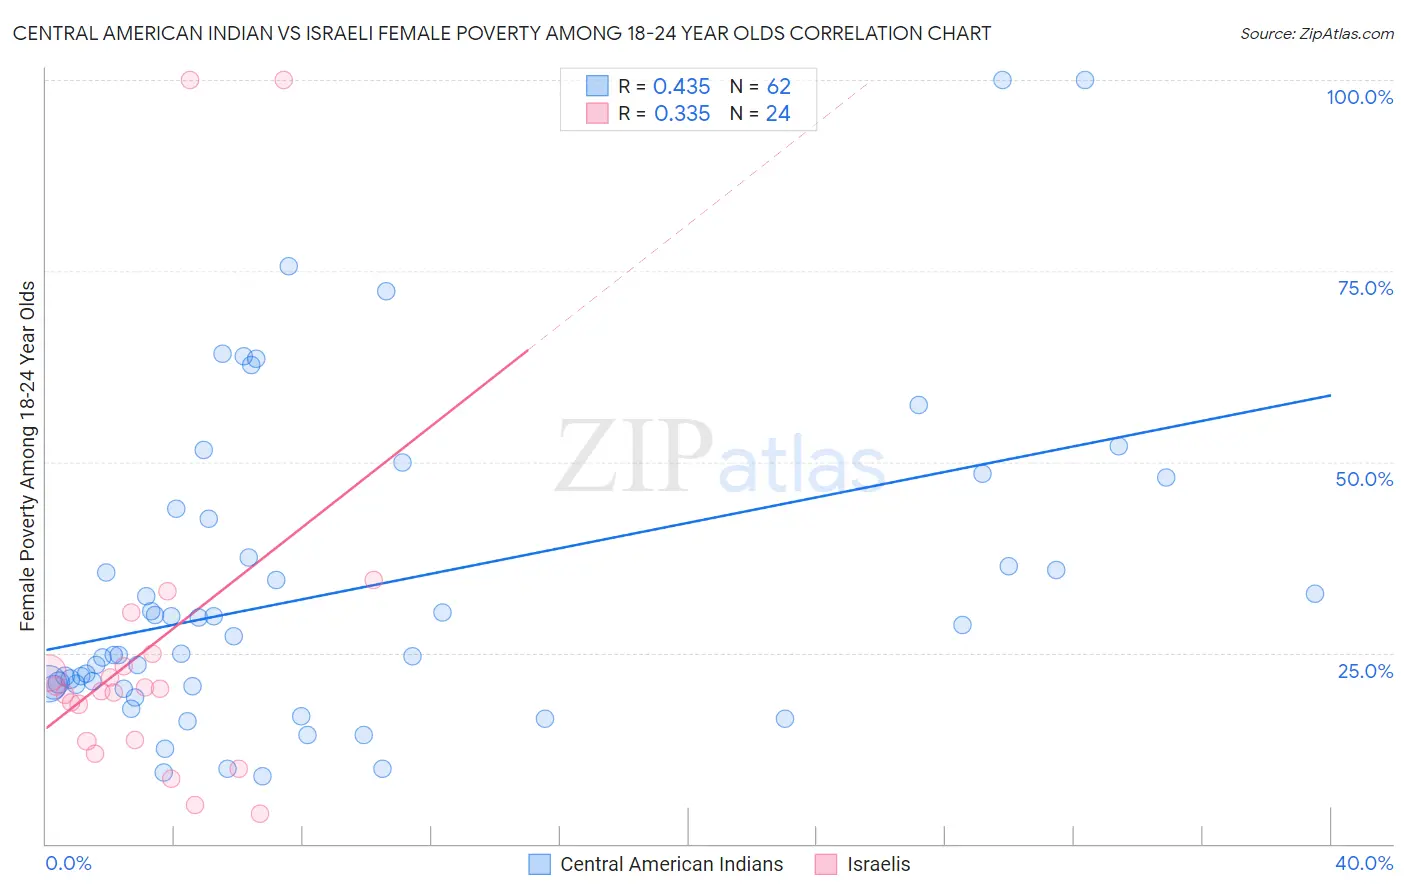
Central American Indian vs Israeli Female Poverty Among 18-24 Year Olds Correlation Chart
The statistical analysis conducted on geographies consisting of 322,009,816 people shows a moderate positive correlation between the proportion of Central American Indians and poverty level among females between the ages 18 and 24 in the United States with a correlation coefficient (R) of 0.435 and weighted average of 22.6%. Similarly, the statistical analysis conducted on geographies consisting of 207,640,312 people shows a mild positive correlation between the proportion of Israelis and poverty level among females between the ages 18 and 24 in the United States with a correlation coefficient (R) of 0.335 and weighted average of 20.9%, a difference of 8.2%.
Female Poverty Among 18-24 Year Olds Correlation Summary
| Measurement | Central American Indian | Israeli |
| Minimum | 8.8% | 4.0% |
| Maximum | 100.0% | 100.0% |
| Range | 91.2% | 96.0% |
| Mean | 33.2% | 25.6% |
| Median | 26.0% | 20.2% |
| Interquartile 25% (IQ1) | 20.6% | 13.5% |
| Interquartile 75% (IQ3) | 42.6% | 24.0% |
| Interquartile Range (IQR) | 22.0% | 10.5% |
| Standard Deviation (Sample) | 20.4% | 24.2% |
| Standard Deviation (Population) | 20.3% | 23.7% |
Similar Demographics by Female Poverty Among 18-24 Year Olds
Demographics Similar to Central American Indians by Female Poverty Among 18-24 Year Olds
In terms of female poverty among 18-24 year olds, the demographic groups most similar to Central American Indians are Inupiat (22.6%, a difference of 0.070%), Menominee (22.5%, a difference of 0.21%), Shoshone (22.5%, a difference of 0.32%), Cherokee (22.7%, a difference of 0.41%), and Indonesian (22.5%, a difference of 0.44%).
| Demographics | Rating | Rank | Female Poverty Among 18-24 Year Olds |
| Bangladeshis | 0.0 /100 | #291 | Tragic 22.5% |
| Alaskan Athabascans | 0.0 /100 | #292 | Tragic 22.5% |
| U.S. Virgin Islanders | 0.0 /100 | #293 | Tragic 22.5% |
| Indonesians | 0.0 /100 | #294 | Tragic 22.5% |
| Shoshone | 0.0 /100 | #295 | Tragic 22.5% |
| Menominee | 0.0 /100 | #296 | Tragic 22.5% |
| Inupiat | 0.0 /100 | #297 | Tragic 22.6% |
| Central American Indians | 0.0 /100 | #298 | Tragic 22.6% |
| Cherokee | 0.0 /100 | #299 | Tragic 22.7% |
| Africans | 0.0 /100 | #300 | Tragic 22.8% |
| Seminole | 0.0 /100 | #301 | Tragic 22.9% |
| Iroquois | 0.0 /100 | #302 | Tragic 22.9% |
| Senegalese | 0.0 /100 | #303 | Tragic 23.0% |
| Sudanese | 0.0 /100 | #304 | Tragic 23.0% |
| Immigrants | Kuwait | 0.0 /100 | #305 | Tragic 23.0% |
Demographics Similar to Israelis by Female Poverty Among 18-24 Year Olds
In terms of female poverty among 18-24 year olds, the demographic groups most similar to Israelis are Immigrants from Eritrea (20.9%, a difference of 0.010%), Luxembourger (20.9%, a difference of 0.030%), Immigrants from Guatemala (20.9%, a difference of 0.050%), Immigrants from Singapore (20.9%, a difference of 0.060%), and Scottish (20.9%, a difference of 0.10%).
| Demographics | Rating | Rank | Female Poverty Among 18-24 Year Olds |
| Immigrants | Uganda | 5.1 /100 | #235 | Tragic 20.8% |
| Okinawans | 4.9 /100 | #236 | Tragic 20.8% |
| Scottish | 4.5 /100 | #237 | Tragic 20.9% |
| Immigrants | Singapore | 4.4 /100 | #238 | Tragic 20.9% |
| Immigrants | Guatemala | 4.3 /100 | #239 | Tragic 20.9% |
| Luxembourgers | 4.2 /100 | #240 | Tragic 20.9% |
| Immigrants | Eritrea | 4.2 /100 | #241 | Tragic 20.9% |
| Israelis | 4.1 /100 | #242 | Tragic 20.9% |
| Marshallese | 3.4 /100 | #243 | Tragic 20.9% |
| Immigrants | Thailand | 3.4 /100 | #244 | Tragic 20.9% |
| Aleuts | 3.3 /100 | #245 | Tragic 20.9% |
| Immigrants | Australia | 3.1 /100 | #246 | Tragic 20.9% |
| Immigrants | Africa | 3.0 /100 | #247 | Tragic 21.0% |
| Immigrants | Kenya | 2.5 /100 | #248 | Tragic 21.0% |
| Carpatho Rusyns | 2.5 /100 | #249 | Tragic 21.0% |