Central American Indian vs Ottawa Female Poverty Among 18-24 Year Olds
COMPARE
Central American Indian
Ottawa
Female Poverty Among 18-24 Year Olds
Female Poverty Among 18-24 Year Olds Comparison
Central American Indians
Ottawa
22.6%
FEMALE POVERTY AMONG 18-24 YEAR OLDS
0.0/ 100
METRIC RATING
298th/ 347
METRIC RANK
22.0%
FEMALE POVERTY AMONG 18-24 YEAR OLDS
0.0/ 100
METRIC RATING
285th/ 347
METRIC RANK
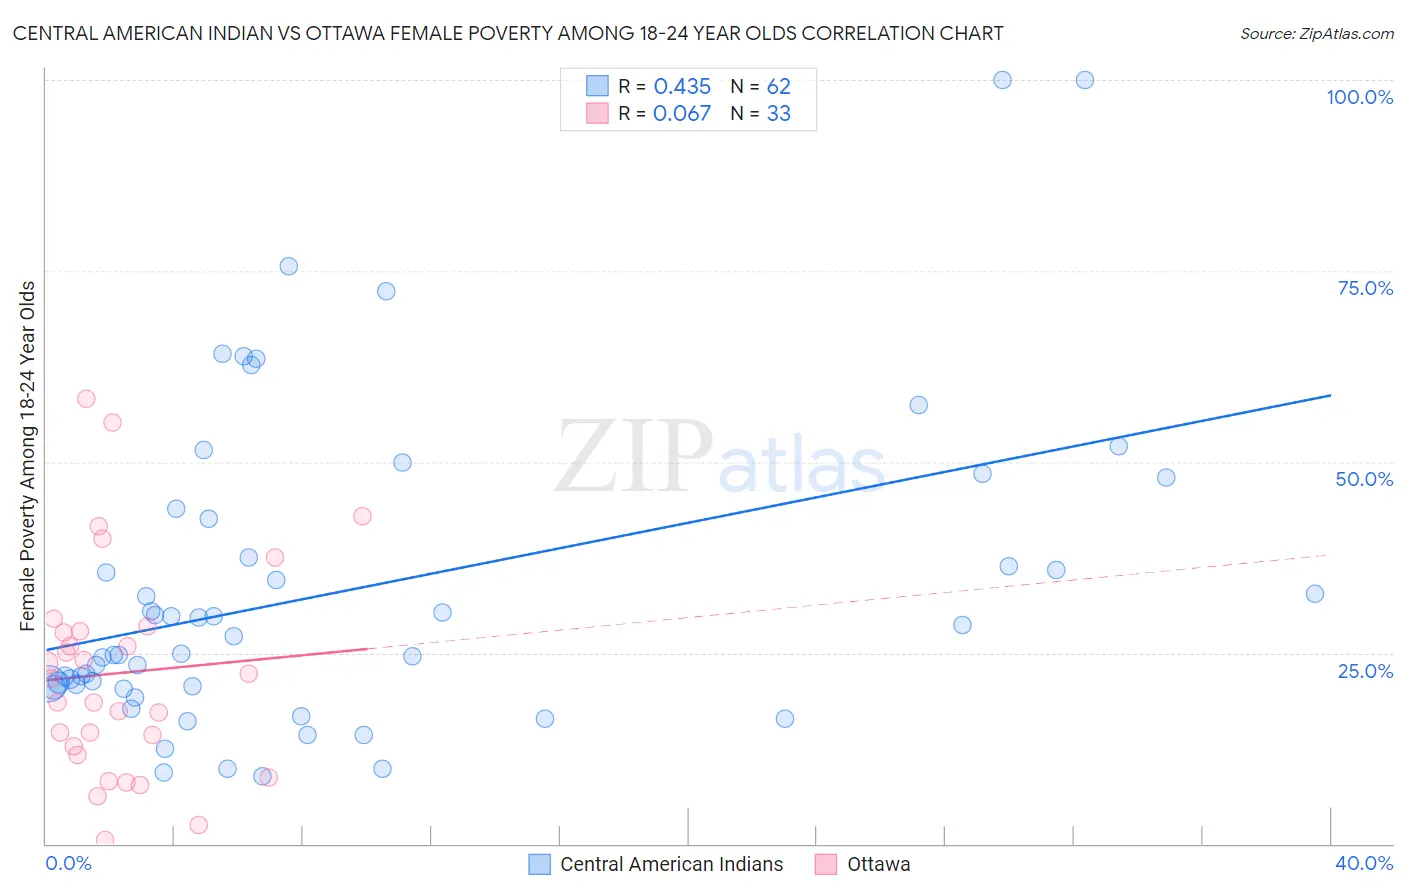
Central American Indian vs Ottawa Female Poverty Among 18-24 Year Olds Correlation Chart
The statistical analysis conducted on geographies consisting of 322,009,816 people shows a moderate positive correlation between the proportion of Central American Indians and poverty level among females between the ages 18 and 24 in the United States with a correlation coefficient (R) of 0.435 and weighted average of 22.6%. Similarly, the statistical analysis conducted on geographies consisting of 49,589,208 people shows a slight positive correlation between the proportion of Ottawa and poverty level among females between the ages 18 and 24 in the United States with a correlation coefficient (R) of 0.067 and weighted average of 22.0%, a difference of 2.5%.
Female Poverty Among 18-24 Year Olds Correlation Summary
| Measurement | Central American Indian | Ottawa |
| Minimum | 8.8% | 0.42% |
| Maximum | 100.0% | 58.3% |
| Range | 91.2% | 57.9% |
| Mean | 33.2% | 22.4% |
| Median | 26.0% | 21.6% |
| Interquartile 25% (IQ1) | 20.6% | 12.2% |
| Interquartile 75% (IQ3) | 42.6% | 28.1% |
| Interquartile Range (IQR) | 22.0% | 15.9% |
| Standard Deviation (Sample) | 20.4% | 14.0% |
| Standard Deviation (Population) | 20.3% | 13.8% |
Demographics Similar to Central American Indians and Ottawa by Female Poverty Among 18-24 Year Olds
In terms of female poverty among 18-24 year olds, the demographic groups most similar to Central American Indians are Inupiat (22.6%, a difference of 0.070%), Menominee (22.5%, a difference of 0.21%), Shoshone (22.5%, a difference of 0.32%), Cherokee (22.7%, a difference of 0.41%), and Indonesian (22.5%, a difference of 0.44%). Similarly, the demographic groups most similar to Ottawa are Tlingit-Haida (22.0%, a difference of 0.12%), Subsaharan African (22.0%, a difference of 0.13%), Ugandan (22.1%, a difference of 0.19%), Immigrants from Middle Africa (22.1%, a difference of 0.20%), and Bermudan (21.9%, a difference of 0.43%).
| Demographics | Rating | Rank | Female Poverty Among 18-24 Year Olds |
| Immigrants | Dominican Republic | 0.1 /100 | #281 | Tragic 21.9% |
| Bermudans | 0.1 /100 | #282 | Tragic 21.9% |
| Sub-Saharan Africans | 0.0 /100 | #283 | Tragic 22.0% |
| Tlingit-Haida | 0.0 /100 | #284 | Tragic 22.0% |
| Ottawa | 0.0 /100 | #285 | Tragic 22.0% |
| Ugandans | 0.0 /100 | #286 | Tragic 22.1% |
| Immigrants | Middle Africa | 0.0 /100 | #287 | Tragic 22.1% |
| Dominicans | 0.0 /100 | #288 | Tragic 22.3% |
| French American Indians | 0.0 /100 | #289 | Tragic 22.3% |
| Immigrants | Senegal | 0.0 /100 | #290 | Tragic 22.4% |
| Bangladeshis | 0.0 /100 | #291 | Tragic 22.5% |
| Alaskan Athabascans | 0.0 /100 | #292 | Tragic 22.5% |
| U.S. Virgin Islanders | 0.0 /100 | #293 | Tragic 22.5% |
| Indonesians | 0.0 /100 | #294 | Tragic 22.5% |
| Shoshone | 0.0 /100 | #295 | Tragic 22.5% |
| Menominee | 0.0 /100 | #296 | Tragic 22.5% |
| Inupiat | 0.0 /100 | #297 | Tragic 22.6% |
| Central American Indians | 0.0 /100 | #298 | Tragic 22.6% |
| Cherokee | 0.0 /100 | #299 | Tragic 22.7% |
| Africans | 0.0 /100 | #300 | Tragic 22.8% |
| Seminole | 0.0 /100 | #301 | Tragic 22.9% |