Immigrants from Moldova vs Croatian Single Father Poverty
COMPARE
Immigrants from Moldova
Croatian
Single Father Poverty
Single Father Poverty Comparison
Immigrants from Moldova
Croatians
15.2%
SINGLE FATHER POVERTY
99.8/ 100
METRIC RATING
66th/ 347
METRIC RANK
17.1%
SINGLE FATHER POVERTY
1.0/ 100
METRIC RATING
252nd/ 347
METRIC RANK
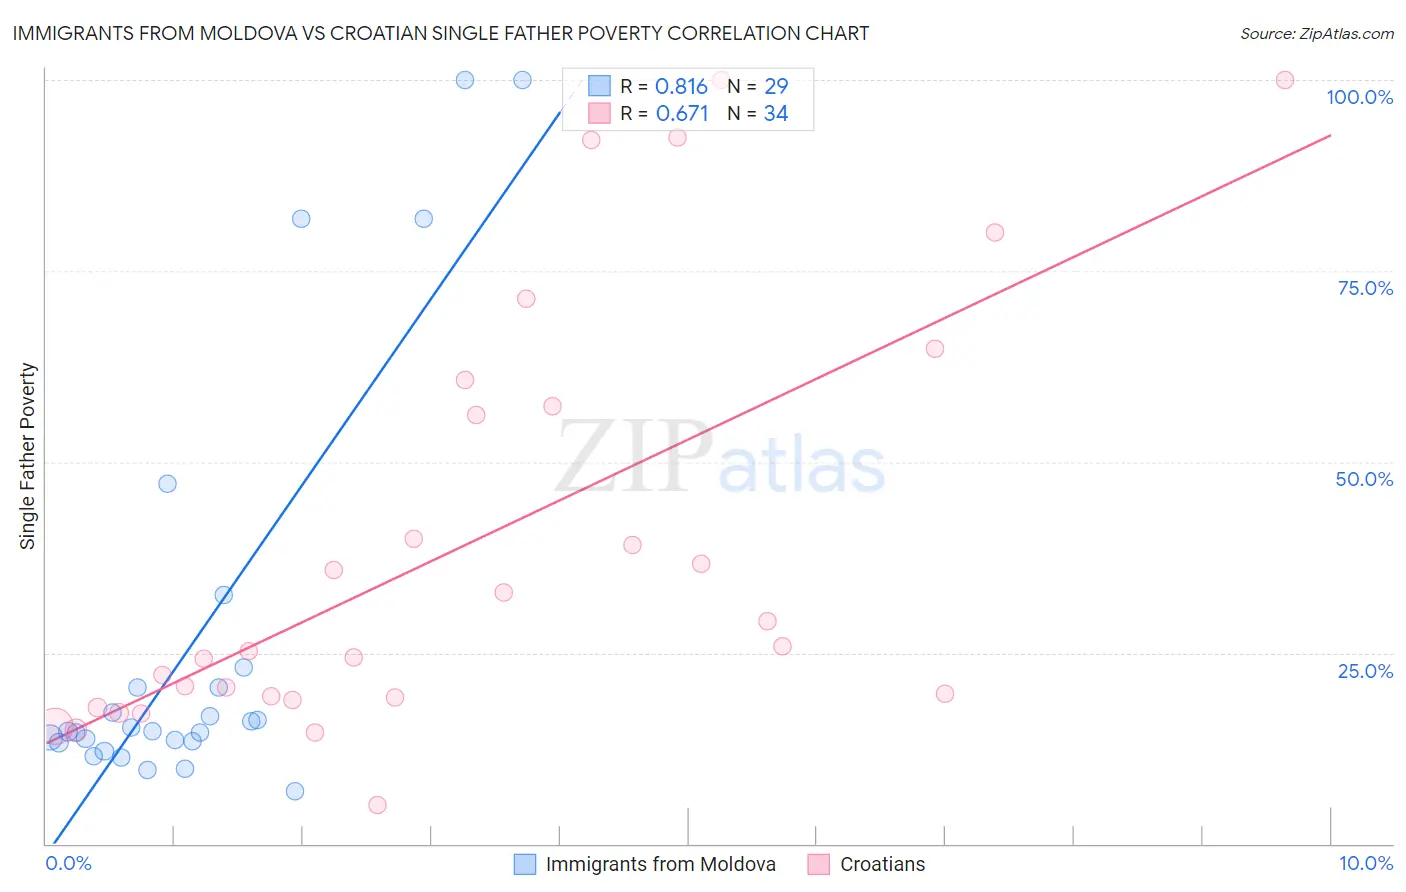
Immigrants from Moldova vs Croatian Single Father Poverty Correlation Chart
The statistical analysis conducted on geographies consisting of 107,585,694 people shows a very strong positive correlation between the proportion of Immigrants from Moldova and poverty level among single fathers in the United States with a correlation coefficient (R) of 0.816 and weighted average of 15.2%. Similarly, the statistical analysis conducted on geographies consisting of 290,349,710 people shows a significant positive correlation between the proportion of Croatians and poverty level among single fathers in the United States with a correlation coefficient (R) of 0.671 and weighted average of 17.1%, a difference of 12.6%.
Single Father Poverty Correlation Summary
| Measurement | Immigrants from Moldova | Croatian |
| Minimum | 6.9% | 5.0% |
| Maximum | 100.0% | 100.0% |
| Range | 93.1% | 95.0% |
| Mean | 26.8% | 39.1% |
| Median | 14.7% | 25.6% |
| Interquartile 25% (IQ1) | 13.3% | 19.1% |
| Interquartile 75% (IQ3) | 21.8% | 57.3% |
| Interquartile Range (IQR) | 8.4% | 38.2% |
| Standard Deviation (Sample) | 27.4% | 27.7% |
| Standard Deviation (Population) | 26.9% | 27.3% |
Similar Demographics by Single Father Poverty
Demographics Similar to Immigrants from Moldova by Single Father Poverty
In terms of single father poverty, the demographic groups most similar to Immigrants from Moldova are Immigrants from Malaysia (15.2%, a difference of 0.020%), Paraguayan (15.2%, a difference of 0.090%), Bangladeshi (15.2%, a difference of 0.11%), Immigrants from Cameroon (15.2%, a difference of 0.18%), and Immigrants from Sweden (15.2%, a difference of 0.19%).
| Demographics | Rating | Rank | Single Father Poverty |
| Guamanians/Chamorros | 99.9 /100 | #59 | Exceptional 15.1% |
| Puget Sound Salish | 99.8 /100 | #60 | Exceptional 15.2% |
| Immigrants | Bosnia and Herzegovina | 99.8 /100 | #61 | Exceptional 15.2% |
| Immigrants | Armenia | 99.8 /100 | #62 | Exceptional 15.2% |
| Immigrants | Sweden | 99.8 /100 | #63 | Exceptional 15.2% |
| Bangladeshis | 99.8 /100 | #64 | Exceptional 15.2% |
| Immigrants | Malaysia | 99.8 /100 | #65 | Exceptional 15.2% |
| Immigrants | Moldova | 99.8 /100 | #66 | Exceptional 15.2% |
| Paraguayans | 99.7 /100 | #67 | Exceptional 15.2% |
| Immigrants | Cameroon | 99.7 /100 | #68 | Exceptional 15.2% |
| Japanese | 99.7 /100 | #69 | Exceptional 15.2% |
| Mongolians | 99.7 /100 | #70 | Exceptional 15.3% |
| Immigrants | Brazil | 99.6 /100 | #71 | Exceptional 15.3% |
| Immigrants | Lithuania | 99.6 /100 | #72 | Exceptional 15.3% |
| Kenyans | 99.6 /100 | #73 | Exceptional 15.3% |
Demographics Similar to Croatians by Single Father Poverty
In terms of single father poverty, the demographic groups most similar to Croatians are Cree (17.1%, a difference of 0.010%), Luxembourger (17.1%, a difference of 0.10%), Austrian (17.1%, a difference of 0.11%), Immigrants from Honduras (17.1%, a difference of 0.12%), and Canadian (17.1%, a difference of 0.24%).
| Demographics | Rating | Rank | Single Father Poverty |
| Trinidadians and Tobagonians | 1.5 /100 | #245 | Tragic 17.0% |
| Immigrants | Ireland | 1.4 /100 | #246 | Tragic 17.1% |
| Greeks | 1.3 /100 | #247 | Tragic 17.1% |
| Czechoslovakians | 1.3 /100 | #248 | Tragic 17.1% |
| Canadians | 1.3 /100 | #249 | Tragic 17.1% |
| Austrians | 1.1 /100 | #250 | Tragic 17.1% |
| Luxembourgers | 1.1 /100 | #251 | Tragic 17.1% |
| Croatians | 1.0 /100 | #252 | Tragic 17.1% |
| Cree | 1.0 /100 | #253 | Tragic 17.1% |
| Immigrants | Honduras | 0.9 /100 | #254 | Tragic 17.1% |
| Sierra Leoneans | 0.8 /100 | #255 | Tragic 17.2% |
| Immigrants | Haiti | 0.8 /100 | #256 | Tragic 17.2% |
| Immigrants | Albania | 0.7 /100 | #257 | Tragic 17.2% |
| Albanians | 0.7 /100 | #258 | Tragic 17.2% |
| Immigrants | Jamaica | 0.7 /100 | #259 | Tragic 17.2% |