Immigrants from Eritrea vs Croatian Single Father Poverty
COMPARE
Immigrants from Eritrea
Croatian
Single Father Poverty
Single Father Poverty Comparison
Immigrants from Eritrea
Croatians
14.8%
SINGLE FATHER POVERTY
100.0/ 100
METRIC RATING
43rd/ 347
METRIC RANK
17.1%
SINGLE FATHER POVERTY
1.0/ 100
METRIC RATING
252nd/ 347
METRIC RANK
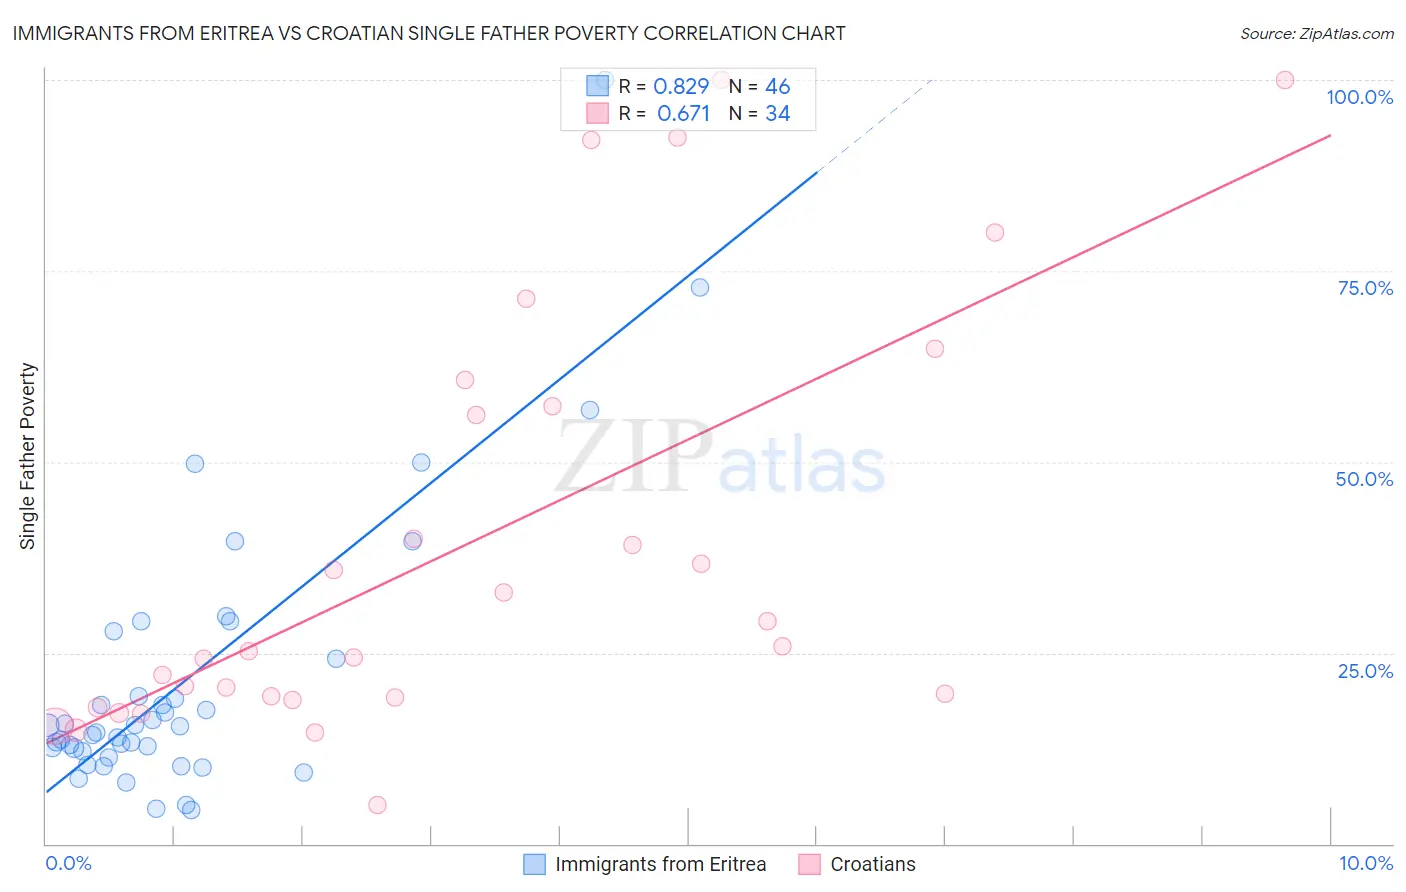
Immigrants from Eritrea vs Croatian Single Father Poverty Correlation Chart
The statistical analysis conducted on geographies consisting of 96,659,601 people shows a very strong positive correlation between the proportion of Immigrants from Eritrea and poverty level among single fathers in the United States with a correlation coefficient (R) of 0.829 and weighted average of 14.8%. Similarly, the statistical analysis conducted on geographies consisting of 290,349,710 people shows a significant positive correlation between the proportion of Croatians and poverty level among single fathers in the United States with a correlation coefficient (R) of 0.671 and weighted average of 17.1%, a difference of 15.7%.
Single Father Poverty Correlation Summary
| Measurement | Immigrants from Eritrea | Croatian |
| Minimum | 4.5% | 5.0% |
| Maximum | 100.0% | 100.0% |
| Range | 95.5% | 95.0% |
| Mean | 21.5% | 39.1% |
| Median | 15.0% | 25.6% |
| Interquartile 25% (IQ1) | 12.2% | 19.1% |
| Interquartile 75% (IQ3) | 24.2% | 57.3% |
| Interquartile Range (IQR) | 12.0% | 38.2% |
| Standard Deviation (Sample) | 18.6% | 27.7% |
| Standard Deviation (Population) | 18.4% | 27.3% |
Similar Demographics by Single Father Poverty
Demographics Similar to Immigrants from Eritrea by Single Father Poverty
In terms of single father poverty, the demographic groups most similar to Immigrants from Eritrea are Indian (Asian) (14.8%, a difference of 0.040%), Immigrants from Nepal (14.8%, a difference of 0.040%), Pima (14.8%, a difference of 0.21%), Immigrants from Asia (14.7%, a difference of 0.41%), and Bolivian (14.7%, a difference of 0.59%).
| Demographics | Rating | Rank | Single Father Poverty |
| Immigrants | Indonesia | 100.0 /100 | #36 | Exceptional 14.7% |
| Immigrants | Eastern Africa | 100.0 /100 | #37 | Exceptional 14.7% |
| Bolivians | 100.0 /100 | #38 | Exceptional 14.7% |
| Immigrants | Asia | 100.0 /100 | #39 | Exceptional 14.7% |
| Pima | 100.0 /100 | #40 | Exceptional 14.8% |
| Indians (Asian) | 100.0 /100 | #41 | Exceptional 14.8% |
| Immigrants | Nepal | 100.0 /100 | #42 | Exceptional 14.8% |
| Immigrants | Eritrea | 100.0 /100 | #43 | Exceptional 14.8% |
| Salvadorans | 100.0 /100 | #44 | Exceptional 14.9% |
| Immigrants | Somalia | 100.0 /100 | #45 | Exceptional 14.9% |
| Immigrants | Cambodia | 99.9 /100 | #46 | Exceptional 14.9% |
| Immigrants | China | 99.9 /100 | #47 | Exceptional 14.9% |
| Malaysians | 99.9 /100 | #48 | Exceptional 14.9% |
| Immigrants | Eastern Asia | 99.9 /100 | #49 | Exceptional 15.0% |
| Bhutanese | 99.9 /100 | #50 | Exceptional 15.0% |
Demographics Similar to Croatians by Single Father Poverty
In terms of single father poverty, the demographic groups most similar to Croatians are Cree (17.1%, a difference of 0.010%), Luxembourger (17.1%, a difference of 0.10%), Austrian (17.1%, a difference of 0.11%), Immigrants from Honduras (17.1%, a difference of 0.12%), and Canadian (17.1%, a difference of 0.24%).
| Demographics | Rating | Rank | Single Father Poverty |
| Trinidadians and Tobagonians | 1.5 /100 | #245 | Tragic 17.0% |
| Immigrants | Ireland | 1.4 /100 | #246 | Tragic 17.1% |
| Greeks | 1.3 /100 | #247 | Tragic 17.1% |
| Czechoslovakians | 1.3 /100 | #248 | Tragic 17.1% |
| Canadians | 1.3 /100 | #249 | Tragic 17.1% |
| Austrians | 1.1 /100 | #250 | Tragic 17.1% |
| Luxembourgers | 1.1 /100 | #251 | Tragic 17.1% |
| Croatians | 1.0 /100 | #252 | Tragic 17.1% |
| Cree | 1.0 /100 | #253 | Tragic 17.1% |
| Immigrants | Honduras | 0.9 /100 | #254 | Tragic 17.1% |
| Sierra Leoneans | 0.8 /100 | #255 | Tragic 17.2% |
| Immigrants | Haiti | 0.8 /100 | #256 | Tragic 17.2% |
| Immigrants | Albania | 0.7 /100 | #257 | Tragic 17.2% |
| Albanians | 0.7 /100 | #258 | Tragic 17.2% |
| Immigrants | Jamaica | 0.7 /100 | #259 | Tragic 17.2% |