Brazilian vs Croatian Single Father Poverty
COMPARE
Brazilian
Croatian
Single Father Poverty
Single Father Poverty Comparison
Brazilians
Croatians
15.5%
SINGLE FATHER POVERTY
99.0/ 100
METRIC RATING
87th/ 347
METRIC RANK
17.1%
SINGLE FATHER POVERTY
1.0/ 100
METRIC RATING
252nd/ 347
METRIC RANK
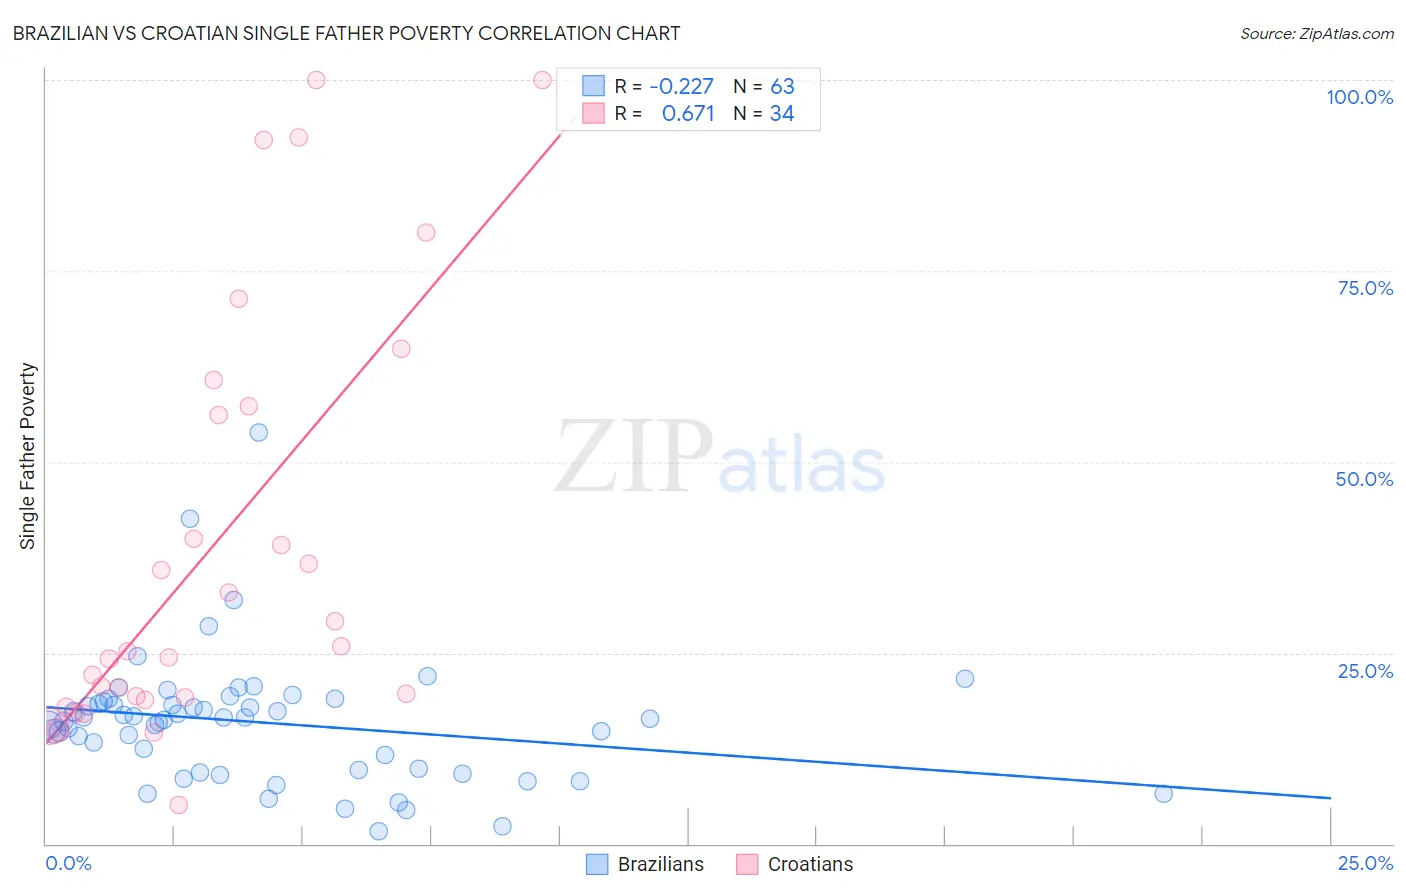
Brazilian vs Croatian Single Father Poverty Correlation Chart
The statistical analysis conducted on geographies consisting of 259,661,498 people shows a weak negative correlation between the proportion of Brazilians and poverty level among single fathers in the United States with a correlation coefficient (R) of -0.227 and weighted average of 15.5%. Similarly, the statistical analysis conducted on geographies consisting of 290,349,710 people shows a significant positive correlation between the proportion of Croatians and poverty level among single fathers in the United States with a correlation coefficient (R) of 0.671 and weighted average of 17.1%, a difference of 10.7%.
Single Father Poverty Correlation Summary
| Measurement | Brazilian | Croatian |
| Minimum | 1.7% | 5.0% |
| Maximum | 53.9% | 100.0% |
| Range | 52.2% | 95.0% |
| Mean | 15.9% | 39.1% |
| Median | 16.4% | 25.6% |
| Interquartile 25% (IQ1) | 9.6% | 19.1% |
| Interquartile 75% (IQ3) | 18.7% | 57.3% |
| Interquartile Range (IQR) | 9.1% | 38.2% |
| Standard Deviation (Sample) | 8.4% | 27.7% |
| Standard Deviation (Population) | 8.4% | 27.3% |
Similar Demographics by Single Father Poverty
Demographics Similar to Brazilians by Single Father Poverty
In terms of single father poverty, the demographic groups most similar to Brazilians are Immigrants from Russia (15.5%, a difference of 0.0%), Burmese (15.5%, a difference of 0.030%), Immigrants from Korea (15.5%, a difference of 0.090%), Immigrants from Oceania (15.4%, a difference of 0.13%), and Peruvian (15.4%, a difference of 0.24%).
| Demographics | Rating | Rank | Single Father Poverty |
| Armenians | 99.4 /100 | #80 | Exceptional 15.4% |
| Immigrants | Congo | 99.4 /100 | #81 | Exceptional 15.4% |
| Immigrants | Ukraine | 99.4 /100 | #82 | Exceptional 15.4% |
| Chinese | 99.3 /100 | #83 | Exceptional 15.4% |
| Peruvians | 99.2 /100 | #84 | Exceptional 15.4% |
| Immigrants | Oceania | 99.1 /100 | #85 | Exceptional 15.4% |
| Immigrants | Russia | 99.0 /100 | #86 | Exceptional 15.5% |
| Brazilians | 99.0 /100 | #87 | Exceptional 15.5% |
| Burmese | 99.0 /100 | #88 | Exceptional 15.5% |
| Immigrants | Korea | 99.0 /100 | #89 | Exceptional 15.5% |
| Mexican American Indians | 98.7 /100 | #90 | Exceptional 15.5% |
| Immigrants | Romania | 98.6 /100 | #91 | Exceptional 15.5% |
| Immigrants | Serbia | 98.5 /100 | #92 | Exceptional 15.5% |
| Basques | 98.4 /100 | #93 | Exceptional 15.5% |
| Immigrants | Uruguay | 98.2 /100 | #94 | Exceptional 15.6% |
Demographics Similar to Croatians by Single Father Poverty
In terms of single father poverty, the demographic groups most similar to Croatians are Cree (17.1%, a difference of 0.010%), Luxembourger (17.1%, a difference of 0.10%), Austrian (17.1%, a difference of 0.11%), Immigrants from Honduras (17.1%, a difference of 0.12%), and Canadian (17.1%, a difference of 0.24%).
| Demographics | Rating | Rank | Single Father Poverty |
| Trinidadians and Tobagonians | 1.5 /100 | #245 | Tragic 17.0% |
| Immigrants | Ireland | 1.4 /100 | #246 | Tragic 17.1% |
| Greeks | 1.3 /100 | #247 | Tragic 17.1% |
| Czechoslovakians | 1.3 /100 | #248 | Tragic 17.1% |
| Canadians | 1.3 /100 | #249 | Tragic 17.1% |
| Austrians | 1.1 /100 | #250 | Tragic 17.1% |
| Luxembourgers | 1.1 /100 | #251 | Tragic 17.1% |
| Croatians | 1.0 /100 | #252 | Tragic 17.1% |
| Cree | 1.0 /100 | #253 | Tragic 17.1% |
| Immigrants | Honduras | 0.9 /100 | #254 | Tragic 17.1% |
| Sierra Leoneans | 0.8 /100 | #255 | Tragic 17.2% |
| Immigrants | Haiti | 0.8 /100 | #256 | Tragic 17.2% |
| Immigrants | Albania | 0.7 /100 | #257 | Tragic 17.2% |
| Albanians | 0.7 /100 | #258 | Tragic 17.2% |
| Immigrants | Jamaica | 0.7 /100 | #259 | Tragic 17.2% |