Celtic vs Potawatomi Single Mother Poverty
COMPARE
Celtic
Potawatomi
Single Mother Poverty
Single Mother Poverty Comparison
Celtics
Potawatomi
30.9%
SINGLE MOTHER POVERTY
0.6/ 100
METRIC RATING
253rd/ 347
METRIC RANK
34.1%
SINGLE MOTHER POVERTY
0.0/ 100
METRIC RATING
309th/ 347
METRIC RANK
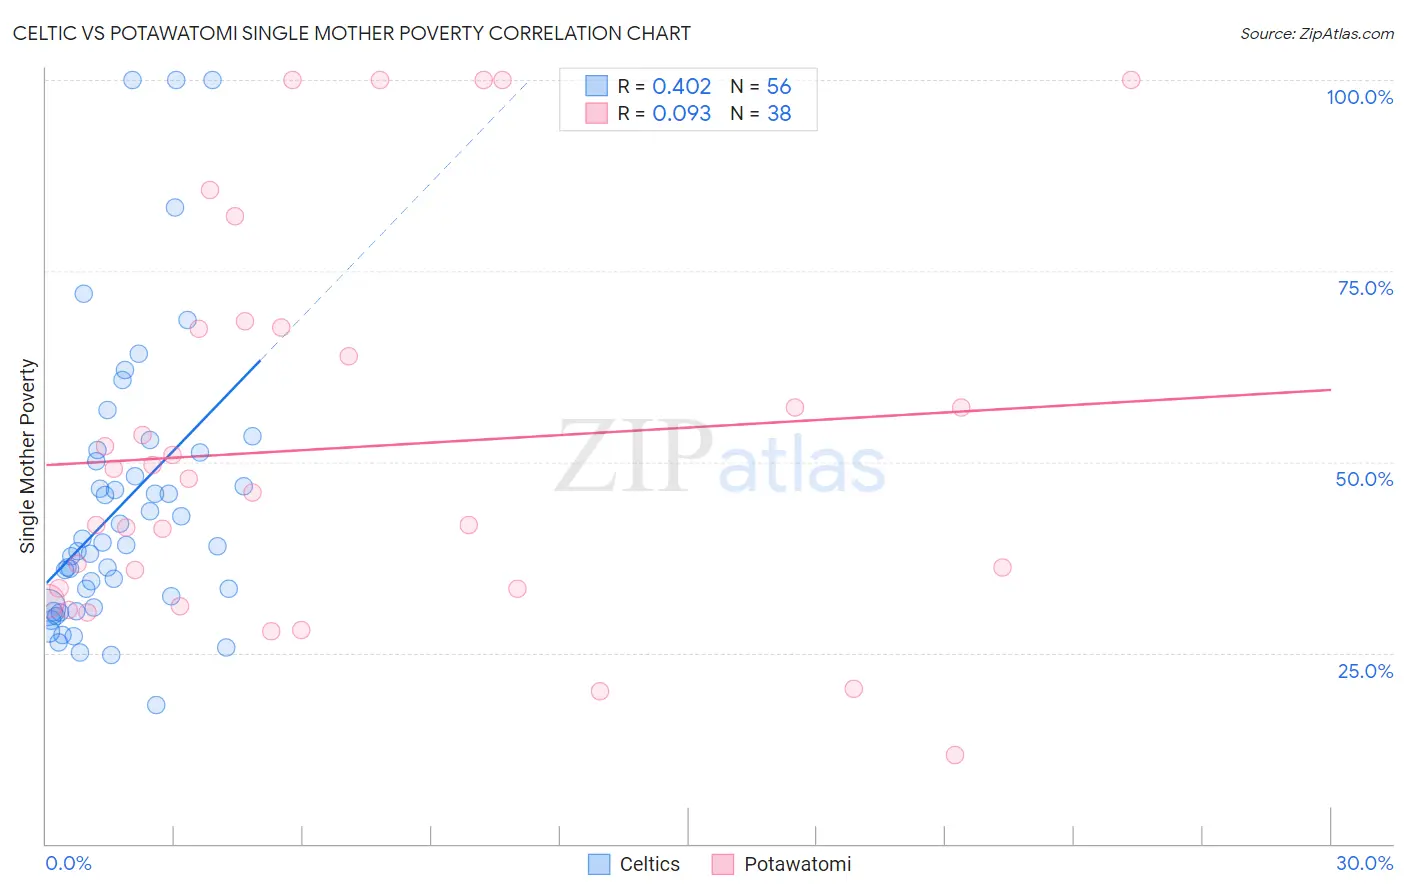
Celtic vs Potawatomi Single Mother Poverty Correlation Chart
The statistical analysis conducted on geographies consisting of 166,872,961 people shows a moderate positive correlation between the proportion of Celtics and poverty level among single mothers in the United States with a correlation coefficient (R) of 0.402 and weighted average of 30.9%. Similarly, the statistical analysis conducted on geographies consisting of 116,799,639 people shows a slight positive correlation between the proportion of Potawatomi and poverty level among single mothers in the United States with a correlation coefficient (R) of 0.093 and weighted average of 34.1%, a difference of 10.3%.
Single Mother Poverty Correlation Summary
| Measurement | Celtic | Potawatomi |
| Minimum | 18.2% | 11.6% |
| Maximum | 100.0% | 100.0% |
| Range | 81.8% | 88.4% |
| Mean | 44.3% | 51.9% |
| Median | 39.0% | 46.9% |
| Interquartile 25% (IQ1) | 30.9% | 33.3% |
| Interquartile 75% (IQ3) | 50.7% | 67.5% |
| Interquartile Range (IQR) | 19.7% | 34.2% |
| Standard Deviation (Sample) | 18.6% | 25.0% |
| Standard Deviation (Population) | 18.4% | 24.6% |
Similar Demographics by Single Mother Poverty
Demographics Similar to Celtics by Single Mother Poverty
In terms of single mother poverty, the demographic groups most similar to Celtics are Alaska Native (30.9%, a difference of 0.030%), Tlingit-Haida (30.9%, a difference of 0.040%), Senegalese (31.0%, a difference of 0.14%), Vietnamese (30.9%, a difference of 0.16%), and Belizean (31.0%, a difference of 0.25%).
| Demographics | Rating | Rank | Single Mother Poverty |
| Ecuadorians | 0.9 /100 | #246 | Tragic 30.8% |
| West Indians | 0.9 /100 | #247 | Tragic 30.8% |
| French Canadians | 0.9 /100 | #248 | Tragic 30.8% |
| Cape Verdeans | 0.8 /100 | #249 | Tragic 30.8% |
| Vietnamese | 0.7 /100 | #250 | Tragic 30.9% |
| Tlingit-Haida | 0.6 /100 | #251 | Tragic 30.9% |
| Alaska Natives | 0.6 /100 | #252 | Tragic 30.9% |
| Celtics | 0.6 /100 | #253 | Tragic 30.9% |
| Senegalese | 0.5 /100 | #254 | Tragic 31.0% |
| Belizeans | 0.5 /100 | #255 | Tragic 31.0% |
| Immigrants | West Indies | 0.4 /100 | #256 | Tragic 31.1% |
| Immigrants | Bahamas | 0.4 /100 | #257 | Tragic 31.1% |
| Immigrants | Caribbean | 0.4 /100 | #258 | Tragic 31.1% |
| Immigrants | Bangladesh | 0.4 /100 | #259 | Tragic 31.1% |
| Whites/Caucasians | 0.3 /100 | #260 | Tragic 31.2% |
Demographics Similar to Potawatomi by Single Mother Poverty
In terms of single mother poverty, the demographic groups most similar to Potawatomi are Honduran (34.2%, a difference of 0.22%), Immigrants from Mexico (34.0%, a difference of 0.42%), Alsatian (34.3%, a difference of 0.53%), Comanche (33.9%, a difference of 0.60%), and Central American Indian (34.3%, a difference of 0.61%).
| Demographics | Rating | Rank | Single Mother Poverty |
| Arapaho | 0.0 /100 | #302 | Tragic 33.4% |
| Americans | 0.0 /100 | #303 | Tragic 33.5% |
| Mexicans | 0.0 /100 | #304 | Tragic 33.6% |
| Immigrants | Central America | 0.0 /100 | #305 | Tragic 33.6% |
| Immigrants | Congo | 0.0 /100 | #306 | Tragic 33.8% |
| Comanche | 0.0 /100 | #307 | Tragic 33.9% |
| Immigrants | Mexico | 0.0 /100 | #308 | Tragic 34.0% |
| Potawatomi | 0.0 /100 | #309 | Tragic 34.1% |
| Hondurans | 0.0 /100 | #310 | Tragic 34.2% |
| Alsatians | 0.0 /100 | #311 | Tragic 34.3% |
| Central American Indians | 0.0 /100 | #312 | Tragic 34.3% |
| Immigrants | Dominican Republic | 0.0 /100 | #313 | Tragic 34.4% |
| Chickasaw | 0.0 /100 | #314 | Tragic 34.4% |
| Hopi | 0.0 /100 | #315 | Tragic 34.5% |
| Dominicans | 0.0 /100 | #316 | Tragic 34.5% |