Celtic vs Potawatomi Unemployment Among Women with Children Under 6 years
COMPARE
Celtic
Potawatomi
Unemployment Among Women with Children Under 6 years
Unemployment Among Women with Children Under 6 years Comparison
Celtics
Potawatomi
8.3%
UNEMPLOYMENT AMONG WOMEN WITH CHILDREN UNDER 6 YEARS
0.6/ 100
METRIC RATING
256th/ 347
METRIC RANK
9.6%
UNEMPLOYMENT AMONG WOMEN WITH CHILDREN UNDER 6 YEARS
0.0/ 100
METRIC RATING
320th/ 347
METRIC RANK
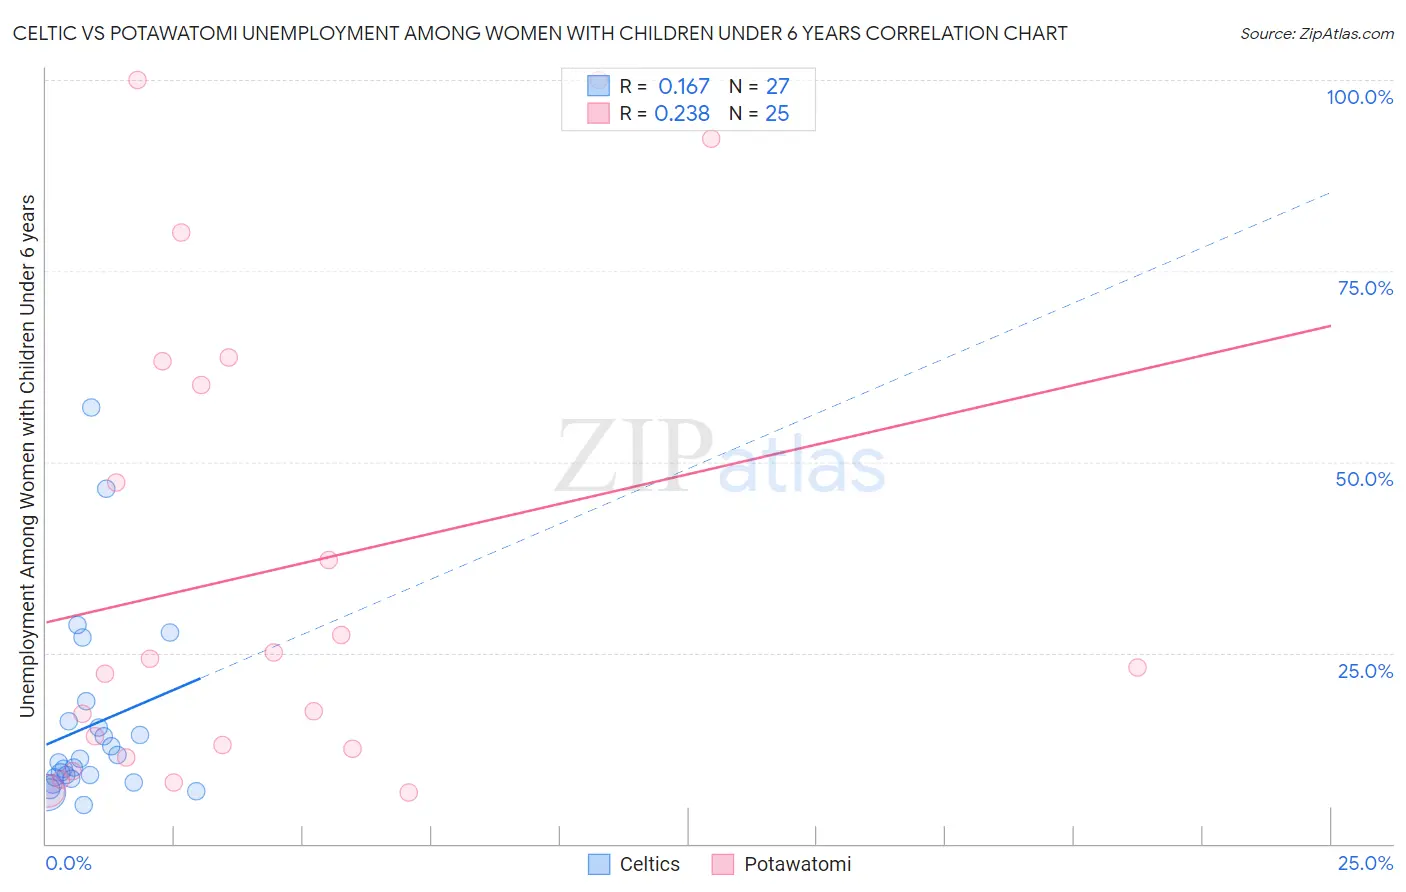
Celtic vs Potawatomi Unemployment Among Women with Children Under 6 years Correlation Chart
The statistical analysis conducted on geographies consisting of 142,115,013 people shows a poor positive correlation between the proportion of Celtics and unemployment rate among women with children under the age of 6 in the United States with a correlation coefficient (R) of 0.167 and weighted average of 8.3%. Similarly, the statistical analysis conducted on geographies consisting of 103,199,576 people shows a weak positive correlation between the proportion of Potawatomi and unemployment rate among women with children under the age of 6 in the United States with a correlation coefficient (R) of 0.238 and weighted average of 9.6%, a difference of 15.5%.
Unemployment Among Women with Children Under 6 years Correlation Summary
| Measurement | Celtic | Potawatomi |
| Minimum | 5.1% | 6.7% |
| Maximum | 57.1% | 100.0% |
| Range | 52.0% | 93.3% |
| Mean | 15.5% | 35.6% |
| Median | 10.7% | 23.1% |
| Interquartile 25% (IQ1) | 8.5% | 11.9% |
| Interquartile 75% (IQ3) | 16.0% | 61.6% |
| Interquartile Range (IQR) | 7.5% | 49.7% |
| Standard Deviation (Sample) | 12.3% | 31.0% |
| Standard Deviation (Population) | 12.1% | 30.4% |
Similar Demographics by Unemployment Among Women with Children Under 6 years
Demographics Similar to Celtics by Unemployment Among Women with Children Under 6 years
In terms of unemployment among women with children under 6 years, the demographic groups most similar to Celtics are Immigrants from Portugal (8.3%, a difference of 0.020%), British West Indian (8.3%, a difference of 0.26%), Immigrants from Ghana (8.3%, a difference of 0.28%), Immigrants from Caribbean (8.3%, a difference of 0.31%), and Immigrants from Guyana (8.2%, a difference of 0.57%).
| Demographics | Rating | Rank | Unemployment Among Women with Children Under 6 years |
| Immigrants | Sierra Leone | 1.1 /100 | #249 | Tragic 8.2% |
| Nigerians | 1.1 /100 | #250 | Tragic 8.2% |
| Guyanese | 1.0 /100 | #251 | Tragic 8.2% |
| Ghanaians | 1.0 /100 | #252 | Tragic 8.2% |
| Immigrants | Guyana | 0.8 /100 | #253 | Tragic 8.2% |
| Immigrants | Caribbean | 0.7 /100 | #254 | Tragic 8.3% |
| Immigrants | Portugal | 0.6 /100 | #255 | Tragic 8.3% |
| Celtics | 0.6 /100 | #256 | Tragic 8.3% |
| British West Indians | 0.5 /100 | #257 | Tragic 8.3% |
| Immigrants | Ghana | 0.5 /100 | #258 | Tragic 8.3% |
| Barbadians | 0.4 /100 | #259 | Tragic 8.3% |
| Whites/Caucasians | 0.3 /100 | #260 | Tragic 8.4% |
| Immigrants | Liberia | 0.3 /100 | #261 | Tragic 8.4% |
| West Indians | 0.3 /100 | #262 | Tragic 8.4% |
| Scotch-Irish | 0.3 /100 | #263 | Tragic 8.4% |
Demographics Similar to Potawatomi by Unemployment Among Women with Children Under 6 years
In terms of unemployment among women with children under 6 years, the demographic groups most similar to Potawatomi are Marshallese (9.6%, a difference of 0.050%), Central American Indian (9.6%, a difference of 0.060%), Alaska Native (9.6%, a difference of 0.31%), Immigrants from Bahamas (9.6%, a difference of 0.50%), and Osage (9.5%, a difference of 1.1%).
| Demographics | Rating | Rank | Unemployment Among Women with Children Under 6 years |
| Americans | 0.0 /100 | #313 | Tragic 9.3% |
| Fijians | 0.0 /100 | #314 | Tragic 9.3% |
| Cherokee | 0.0 /100 | #315 | Tragic 9.3% |
| Houma | 0.0 /100 | #316 | Tragic 9.4% |
| Dutch West Indians | 0.0 /100 | #317 | Tragic 9.5% |
| Osage | 0.0 /100 | #318 | Tragic 9.5% |
| Marshallese | 0.0 /100 | #319 | Tragic 9.6% |
| Potawatomi | 0.0 /100 | #320 | Tragic 9.6% |
| Central American Indians | 0.0 /100 | #321 | Tragic 9.6% |
| Alaska Natives | 0.0 /100 | #322 | Tragic 9.6% |
| Immigrants | Bahamas | 0.0 /100 | #323 | Tragic 9.6% |
| Paiute | 0.0 /100 | #324 | Tragic 9.7% |
| Choctaw | 0.0 /100 | #325 | Tragic 9.8% |
| Delaware | 0.0 /100 | #326 | Tragic 9.8% |
| Ottawa | 0.0 /100 | #327 | Tragic 9.9% |