Celtic vs Fijian Single Mother Poverty
COMPARE
Celtic
Fijian
Single Mother Poverty
Single Mother Poverty Comparison
Celtics
Fijians
30.9%
SINGLE MOTHER POVERTY
0.6/ 100
METRIC RATING
253rd/ 347
METRIC RANK
31.6%
SINGLE MOTHER POVERTY
0.1/ 100
METRIC RATING
273rd/ 347
METRIC RANK
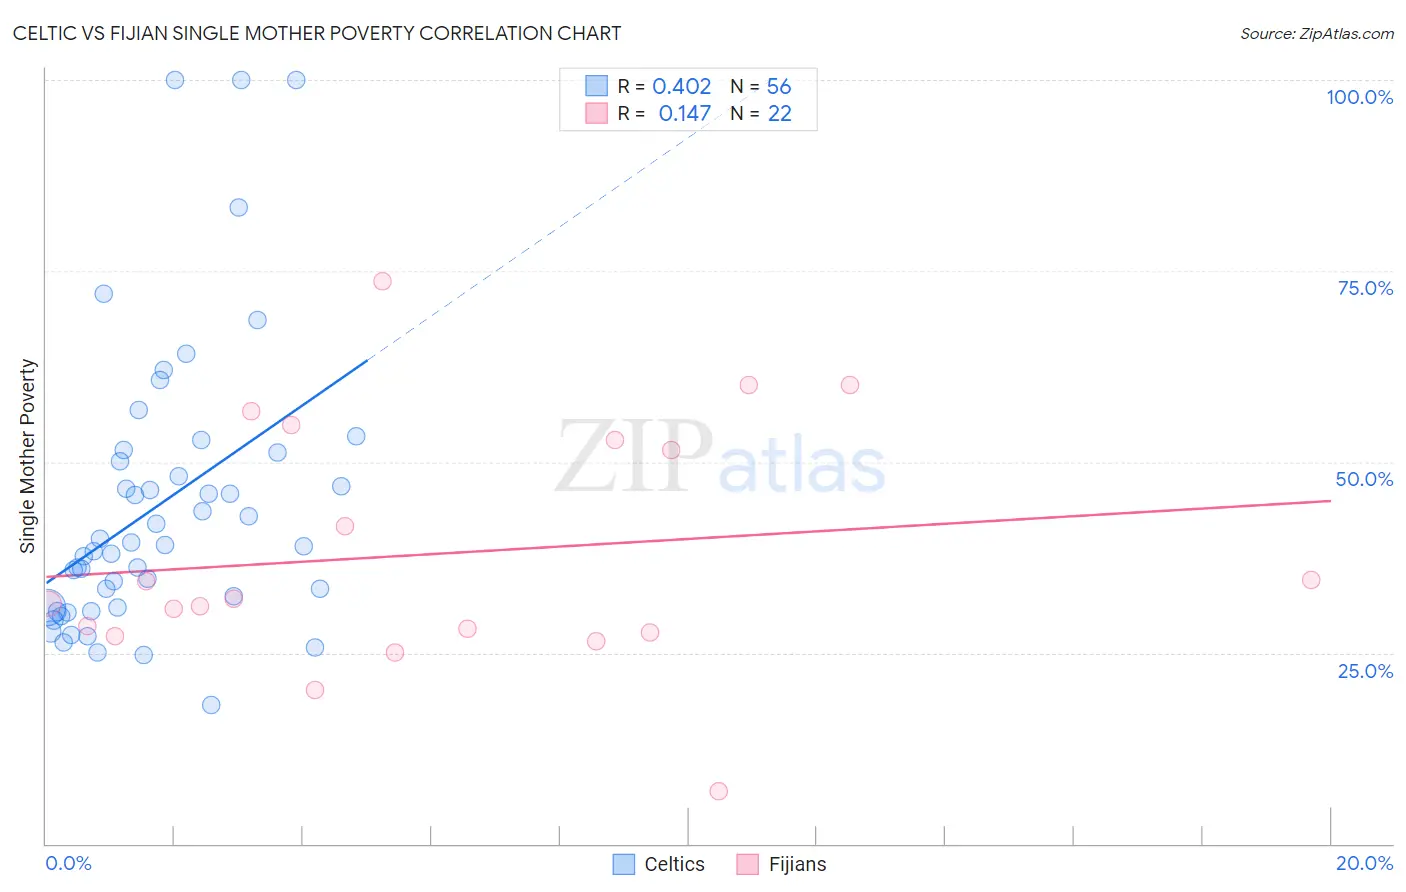
Celtic vs Fijian Single Mother Poverty Correlation Chart
The statistical analysis conducted on geographies consisting of 166,872,961 people shows a moderate positive correlation between the proportion of Celtics and poverty level among single mothers in the United States with a correlation coefficient (R) of 0.402 and weighted average of 30.9%. Similarly, the statistical analysis conducted on geographies consisting of 55,870,068 people shows a poor positive correlation between the proportion of Fijians and poverty level among single mothers in the United States with a correlation coefficient (R) of 0.147 and weighted average of 31.6%, a difference of 2.3%.
Single Mother Poverty Correlation Summary
| Measurement | Celtic | Fijian |
| Minimum | 18.2% | 6.9% |
| Maximum | 100.0% | 73.6% |
| Range | 81.8% | 66.7% |
| Mean | 44.3% | 38.0% |
| Median | 39.0% | 31.8% |
| Interquartile 25% (IQ1) | 30.9% | 27.7% |
| Interquartile 75% (IQ3) | 50.7% | 52.9% |
| Interquartile Range (IQR) | 19.7% | 25.1% |
| Standard Deviation (Sample) | 18.6% | 16.2% |
| Standard Deviation (Population) | 18.4% | 15.8% |
Demographics Similar to Celtics and Fijians by Single Mother Poverty
In terms of single mother poverty, the demographic groups most similar to Celtics are Senegalese (31.0%, a difference of 0.14%), Belizean (31.0%, a difference of 0.25%), Immigrants from West Indies (31.1%, a difference of 0.46%), Immigrants from Bahamas (31.1%, a difference of 0.51%), and Immigrants from Caribbean (31.1%, a difference of 0.59%). Similarly, the demographic groups most similar to Fijians are Immigrants from Micronesia (31.6%, a difference of 0.23%), Immigrants from Cabo Verde (31.6%, a difference of 0.25%), British West Indian (31.5%, a difference of 0.49%), Scotch-Irish (31.5%, a difference of 0.54%), and Immigrants from Senegal (31.5%, a difference of 0.58%).
| Demographics | Rating | Rank | Single Mother Poverty |
| Celtics | 0.6 /100 | #253 | Tragic 30.9% |
| Senegalese | 0.5 /100 | #254 | Tragic 31.0% |
| Belizeans | 0.5 /100 | #255 | Tragic 31.0% |
| Immigrants | West Indies | 0.4 /100 | #256 | Tragic 31.1% |
| Immigrants | Bahamas | 0.4 /100 | #257 | Tragic 31.1% |
| Immigrants | Caribbean | 0.4 /100 | #258 | Tragic 31.1% |
| Immigrants | Bangladesh | 0.4 /100 | #259 | Tragic 31.1% |
| Whites/Caucasians | 0.3 /100 | #260 | Tragic 31.2% |
| Immigrants | El Salvador | 0.3 /100 | #261 | Tragic 31.2% |
| Hmong | 0.3 /100 | #262 | Tragic 31.2% |
| Bahamians | 0.2 /100 | #263 | Tragic 31.3% |
| Immigrants | Ecuador | 0.2 /100 | #264 | Tragic 31.3% |
| German Russians | 0.2 /100 | #265 | Tragic 31.3% |
| Sub-Saharan Africans | 0.2 /100 | #266 | Tragic 31.4% |
| Immigrants | Belize | 0.2 /100 | #267 | Tragic 31.4% |
| Immigrants | Senegal | 0.1 /100 | #268 | Tragic 31.5% |
| Scotch-Irish | 0.1 /100 | #269 | Tragic 31.5% |
| British West Indians | 0.1 /100 | #270 | Tragic 31.5% |
| Immigrants | Cabo Verde | 0.1 /100 | #271 | Tragic 31.6% |
| Immigrants | Micronesia | 0.1 /100 | #272 | Tragic 31.6% |
| Fijians | 0.1 /100 | #273 | Tragic 31.6% |