Celtic vs Immigrants from Ethiopia Single Mother Poverty
COMPARE
Celtic
Immigrants from Ethiopia
Single Mother Poverty
Single Mother Poverty Comparison
Celtics
Immigrants from Ethiopia
30.9%
SINGLE MOTHER POVERTY
0.6/ 100
METRIC RATING
253rd/ 347
METRIC RANK
27.7%
SINGLE MOTHER POVERTY
98.4/ 100
METRIC RATING
89th/ 347
METRIC RANK
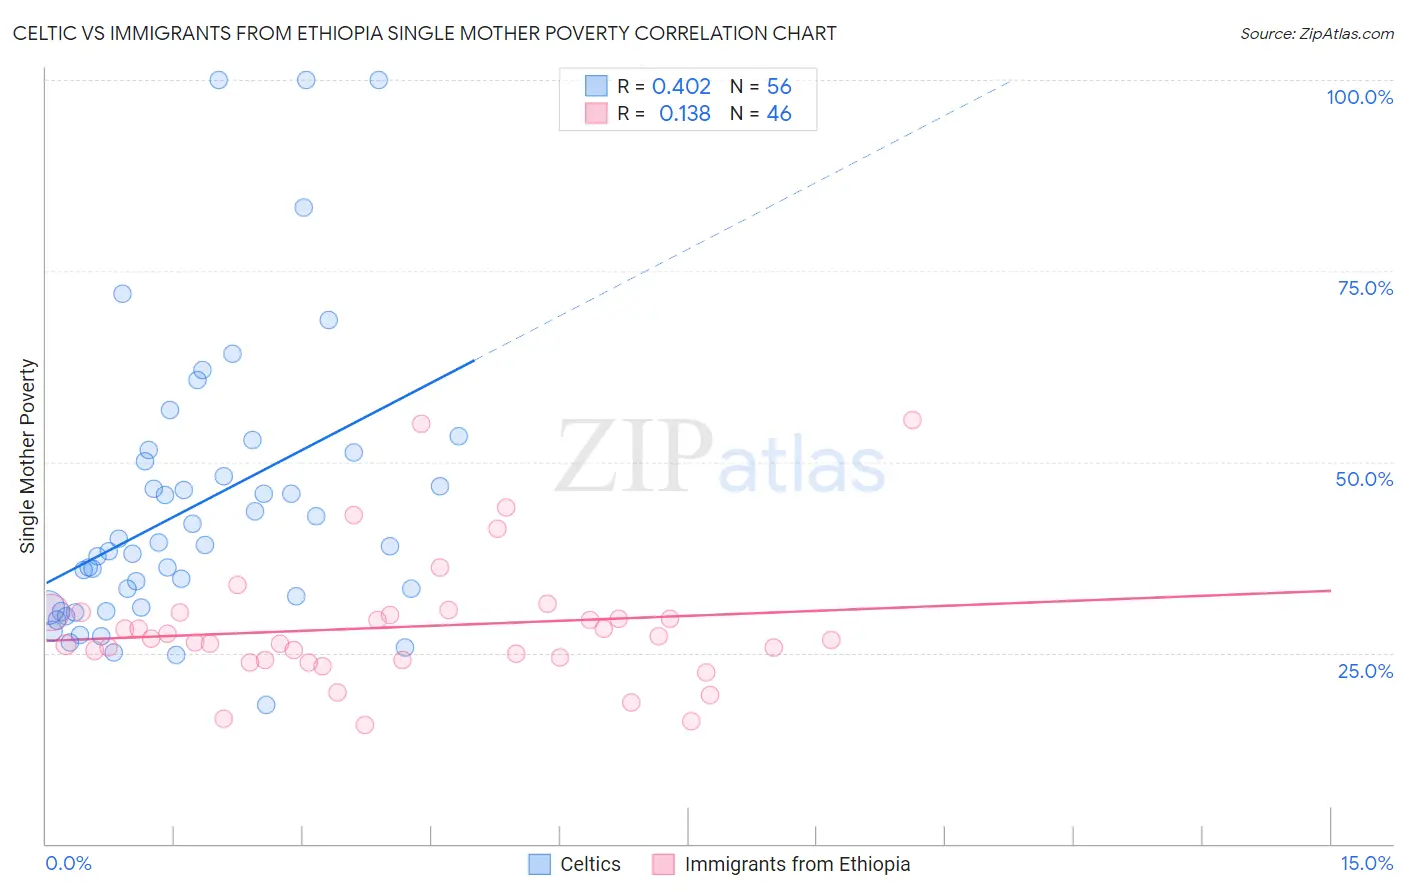
Celtic vs Immigrants from Ethiopia Single Mother Poverty Correlation Chart
The statistical analysis conducted on geographies consisting of 166,872,961 people shows a moderate positive correlation between the proportion of Celtics and poverty level among single mothers in the United States with a correlation coefficient (R) of 0.402 and weighted average of 30.9%. Similarly, the statistical analysis conducted on geographies consisting of 209,365,382 people shows a poor positive correlation between the proportion of Immigrants from Ethiopia and poverty level among single mothers in the United States with a correlation coefficient (R) of 0.138 and weighted average of 27.7%, a difference of 11.6%.
Single Mother Poverty Correlation Summary
| Measurement | Celtic | Immigrants from Ethiopia |
| Minimum | 18.2% | 15.6% |
| Maximum | 100.0% | 55.4% |
| Range | 81.8% | 39.9% |
| Mean | 44.3% | 28.4% |
| Median | 39.0% | 26.7% |
| Interquartile 25% (IQ1) | 30.9% | 24.1% |
| Interquartile 75% (IQ3) | 50.7% | 30.2% |
| Interquartile Range (IQR) | 19.7% | 6.1% |
| Standard Deviation (Sample) | 18.6% | 8.3% |
| Standard Deviation (Population) | 18.4% | 8.2% |
Similar Demographics by Single Mother Poverty
Demographics Similar to Celtics by Single Mother Poverty
In terms of single mother poverty, the demographic groups most similar to Celtics are Alaska Native (30.9%, a difference of 0.030%), Tlingit-Haida (30.9%, a difference of 0.040%), Senegalese (31.0%, a difference of 0.14%), Vietnamese (30.9%, a difference of 0.16%), and Belizean (31.0%, a difference of 0.25%).
| Demographics | Rating | Rank | Single Mother Poverty |
| Ecuadorians | 0.9 /100 | #246 | Tragic 30.8% |
| West Indians | 0.9 /100 | #247 | Tragic 30.8% |
| French Canadians | 0.9 /100 | #248 | Tragic 30.8% |
| Cape Verdeans | 0.8 /100 | #249 | Tragic 30.8% |
| Vietnamese | 0.7 /100 | #250 | Tragic 30.9% |
| Tlingit-Haida | 0.6 /100 | #251 | Tragic 30.9% |
| Alaska Natives | 0.6 /100 | #252 | Tragic 30.9% |
| Celtics | 0.6 /100 | #253 | Tragic 30.9% |
| Senegalese | 0.5 /100 | #254 | Tragic 31.0% |
| Belizeans | 0.5 /100 | #255 | Tragic 31.0% |
| Immigrants | West Indies | 0.4 /100 | #256 | Tragic 31.1% |
| Immigrants | Bahamas | 0.4 /100 | #257 | Tragic 31.1% |
| Immigrants | Caribbean | 0.4 /100 | #258 | Tragic 31.1% |
| Immigrants | Bangladesh | 0.4 /100 | #259 | Tragic 31.1% |
| Whites/Caucasians | 0.3 /100 | #260 | Tragic 31.2% |
Demographics Similar to Immigrants from Ethiopia by Single Mother Poverty
In terms of single mother poverty, the demographic groups most similar to Immigrants from Ethiopia are Ethiopian (27.7%, a difference of 0.020%), Afghan (27.7%, a difference of 0.040%), Immigrants from Ukraine (27.7%, a difference of 0.14%), Immigrants from France (27.8%, a difference of 0.18%), and Immigrants from Latvia (27.7%, a difference of 0.23%).
| Demographics | Rating | Rank | Single Mother Poverty |
| Immigrants | Cameroon | 98.8 /100 | #82 | Exceptional 27.6% |
| Greeks | 98.7 /100 | #83 | Exceptional 27.7% |
| Immigrants | Latvia | 98.7 /100 | #84 | Exceptional 27.7% |
| Mongolians | 98.7 /100 | #85 | Exceptional 27.7% |
| Immigrants | Ukraine | 98.6 /100 | #86 | Exceptional 27.7% |
| Afghans | 98.5 /100 | #87 | Exceptional 27.7% |
| Ethiopians | 98.4 /100 | #88 | Exceptional 27.7% |
| Immigrants | Ethiopia | 98.4 /100 | #89 | Exceptional 27.7% |
| Immigrants | France | 98.2 /100 | #90 | Exceptional 27.8% |
| Immigrants | Albania | 98.0 /100 | #91 | Exceptional 27.8% |
| Estonians | 97.9 /100 | #92 | Exceptional 27.8% |
| Romanians | 97.8 /100 | #93 | Exceptional 27.8% |
| Albanians | 97.6 /100 | #94 | Exceptional 27.9% |
| Chileans | 97.5 /100 | #95 | Exceptional 27.9% |
| Immigrants | Iraq | 97.3 /100 | #96 | Exceptional 27.9% |