Yup'ik vs Potawatomi Single Mother Poverty
COMPARE
Yup'ik
Potawatomi
Single Mother Poverty
Single Mother Poverty Comparison
Yup'ik
Potawatomi
32.5%
SINGLE MOTHER POVERTY
0.0/ 100
METRIC RATING
286th/ 347
METRIC RANK
34.1%
SINGLE MOTHER POVERTY
0.0/ 100
METRIC RATING
309th/ 347
METRIC RANK
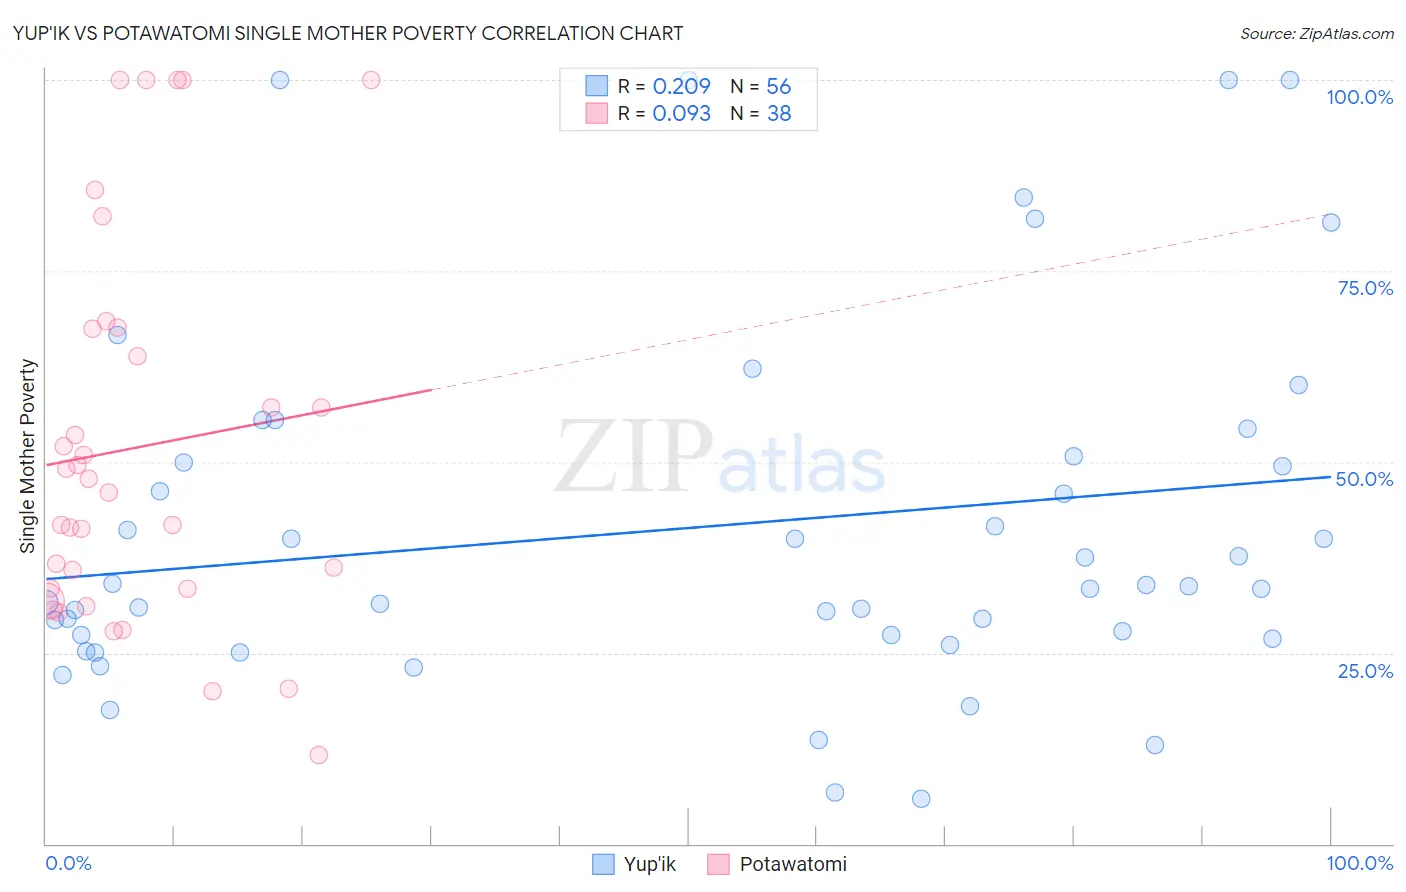
Yup'ik vs Potawatomi Single Mother Poverty Correlation Chart
The statistical analysis conducted on geographies consisting of 39,732,342 people shows a weak positive correlation between the proportion of Yup'ik and poverty level among single mothers in the United States with a correlation coefficient (R) of 0.209 and weighted average of 32.5%. Similarly, the statistical analysis conducted on geographies consisting of 116,799,639 people shows a slight positive correlation between the proportion of Potawatomi and poverty level among single mothers in the United States with a correlation coefficient (R) of 0.093 and weighted average of 34.1%, a difference of 5.2%.
Single Mother Poverty Correlation Summary
| Measurement | Yup'ik | Potawatomi |
| Minimum | 5.9% | 11.6% |
| Maximum | 100.0% | 100.0% |
| Range | 94.1% | 88.4% |
| Mean | 41.4% | 51.9% |
| Median | 33.5% | 46.9% |
| Interquartile 25% (IQ1) | 27.1% | 33.3% |
| Interquartile 75% (IQ3) | 50.3% | 67.5% |
| Interquartile Range (IQR) | 23.3% | 34.2% |
| Standard Deviation (Sample) | 23.6% | 25.0% |
| Standard Deviation (Population) | 23.4% | 24.6% |
Similar Demographics by Single Mother Poverty
Demographics Similar to Yup'ik by Single Mother Poverty
In terms of single mother poverty, the demographic groups most similar to Yup'ik are Immigrants from Latin America (32.4%, a difference of 0.070%), Immigrants from Dominica (32.5%, a difference of 0.13%), Indonesian (32.4%, a difference of 0.19%), Somali (32.6%, a difference of 0.35%), and U.S. Virgin Islander (32.6%, a difference of 0.38%).
| Demographics | Rating | Rank | Single Mother Poverty |
| Marshallese | 0.0 /100 | #279 | Tragic 32.1% |
| Immigrants | Nonimmigrants | 0.0 /100 | #280 | Tragic 32.2% |
| Cree | 0.0 /100 | #281 | Tragic 32.2% |
| Immigrants | Azores | 0.0 /100 | #282 | Tragic 32.2% |
| Spanish Americans | 0.0 /100 | #283 | Tragic 32.3% |
| Indonesians | 0.0 /100 | #284 | Tragic 32.4% |
| Immigrants | Latin America | 0.0 /100 | #285 | Tragic 32.4% |
| Yup'ik | 0.0 /100 | #286 | Tragic 32.5% |
| Immigrants | Dominica | 0.0 /100 | #287 | Tragic 32.5% |
| Somalis | 0.0 /100 | #288 | Tragic 32.6% |
| U.S. Virgin Islanders | 0.0 /100 | #289 | Tragic 32.6% |
| Osage | 0.0 /100 | #290 | Tragic 32.6% |
| Guatemalans | 0.0 /100 | #291 | Tragic 32.9% |
| Shoshone | 0.0 /100 | #292 | Tragic 32.9% |
| Aleuts | 0.0 /100 | #293 | Tragic 32.9% |
Demographics Similar to Potawatomi by Single Mother Poverty
In terms of single mother poverty, the demographic groups most similar to Potawatomi are Honduran (34.2%, a difference of 0.22%), Immigrants from Mexico (34.0%, a difference of 0.42%), Alsatian (34.3%, a difference of 0.53%), Comanche (33.9%, a difference of 0.60%), and Central American Indian (34.3%, a difference of 0.61%).
| Demographics | Rating | Rank | Single Mother Poverty |
| Arapaho | 0.0 /100 | #302 | Tragic 33.4% |
| Americans | 0.0 /100 | #303 | Tragic 33.5% |
| Mexicans | 0.0 /100 | #304 | Tragic 33.6% |
| Immigrants | Central America | 0.0 /100 | #305 | Tragic 33.6% |
| Immigrants | Congo | 0.0 /100 | #306 | Tragic 33.8% |
| Comanche | 0.0 /100 | #307 | Tragic 33.9% |
| Immigrants | Mexico | 0.0 /100 | #308 | Tragic 34.0% |
| Potawatomi | 0.0 /100 | #309 | Tragic 34.1% |
| Hondurans | 0.0 /100 | #310 | Tragic 34.2% |
| Alsatians | 0.0 /100 | #311 | Tragic 34.3% |
| Central American Indians | 0.0 /100 | #312 | Tragic 34.3% |
| Immigrants | Dominican Republic | 0.0 /100 | #313 | Tragic 34.4% |
| Chickasaw | 0.0 /100 | #314 | Tragic 34.4% |
| Hopi | 0.0 /100 | #315 | Tragic 34.5% |
| Dominicans | 0.0 /100 | #316 | Tragic 34.5% |