Palestinian vs Potawatomi Single Mother Poverty
COMPARE
Palestinian
Potawatomi
Single Mother Poverty
Single Mother Poverty Comparison
Palestinians
Potawatomi
27.2%
SINGLE MOTHER POVERTY
99.7/ 100
METRIC RATING
57th/ 347
METRIC RANK
34.1%
SINGLE MOTHER POVERTY
0.0/ 100
METRIC RATING
309th/ 347
METRIC RANK
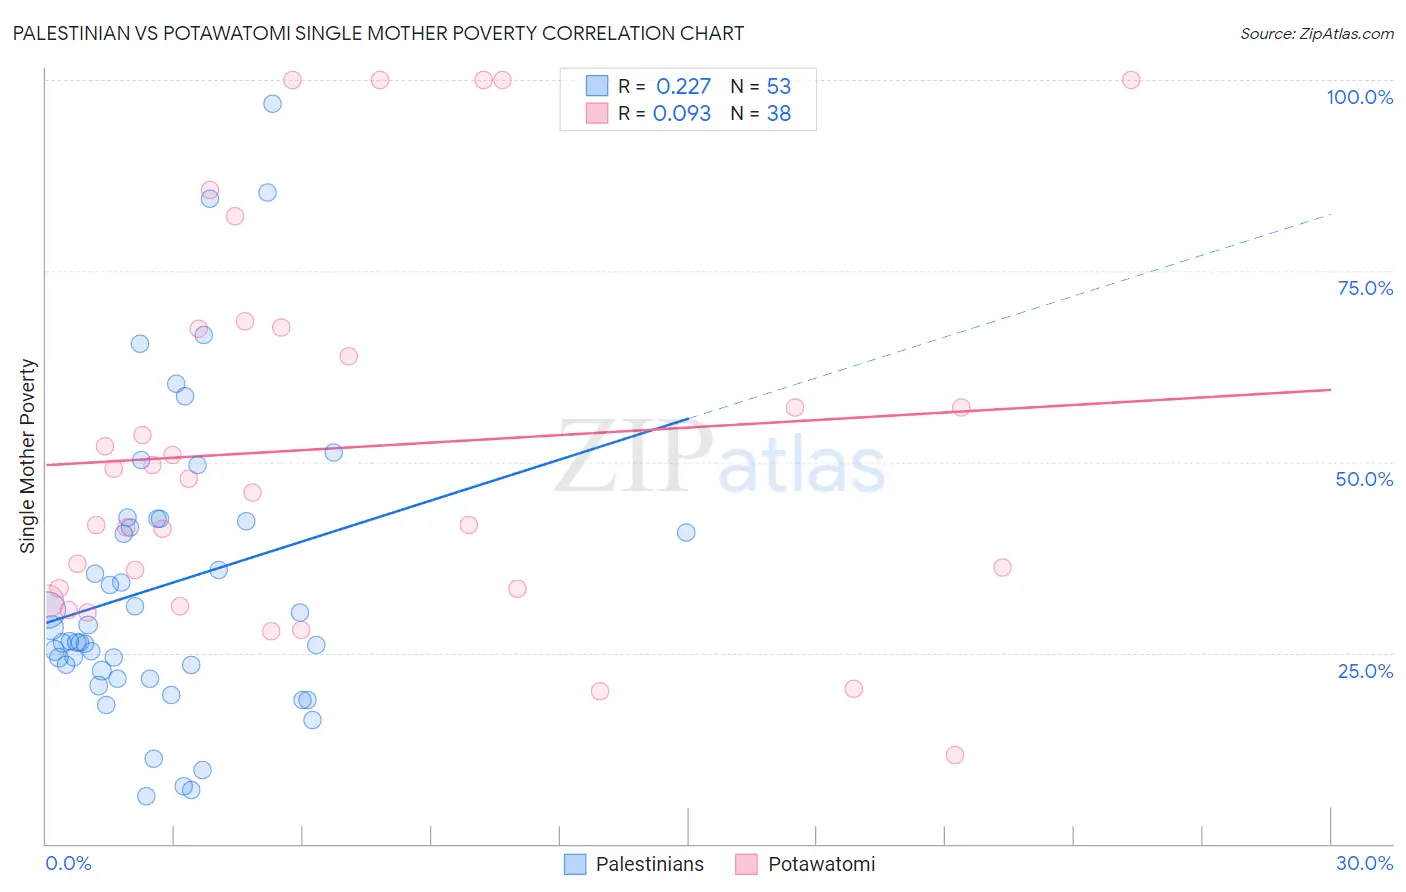
Palestinian vs Potawatomi Single Mother Poverty Correlation Chart
The statistical analysis conducted on geographies consisting of 213,948,713 people shows a weak positive correlation between the proportion of Palestinians and poverty level among single mothers in the United States with a correlation coefficient (R) of 0.227 and weighted average of 27.2%. Similarly, the statistical analysis conducted on geographies consisting of 116,799,639 people shows a slight positive correlation between the proportion of Potawatomi and poverty level among single mothers in the United States with a correlation coefficient (R) of 0.093 and weighted average of 34.1%, a difference of 25.6%.
Single Mother Poverty Correlation Summary
| Measurement | Palestinian | Potawatomi |
| Minimum | 6.2% | 11.6% |
| Maximum | 96.9% | 100.0% |
| Range | 90.7% | 88.4% |
| Mean | 33.9% | 51.9% |
| Median | 26.6% | 46.9% |
| Interquartile 25% (IQ1) | 22.2% | 33.3% |
| Interquartile 75% (IQ3) | 42.4% | 67.5% |
| Interquartile Range (IQR) | 20.3% | 34.2% |
| Standard Deviation (Sample) | 19.6% | 25.0% |
| Standard Deviation (Population) | 19.4% | 24.6% |
Similar Demographics by Single Mother Poverty
Demographics Similar to Palestinians by Single Mother Poverty
In terms of single mother poverty, the demographic groups most similar to Palestinians are Immigrants from Romania (27.2%, a difference of 0.030%), Immigrants from Egypt (27.1%, a difference of 0.080%), Immigrants from Bulgaria (27.1%, a difference of 0.11%), Immigrants from Jordan (27.1%, a difference of 0.14%), and Argentinean (27.2%, a difference of 0.15%).
| Demographics | Rating | Rank | Single Mother Poverty |
| Laotians | 99.8 /100 | #50 | Exceptional 27.0% |
| Immigrants | Argentina | 99.7 /100 | #51 | Exceptional 27.1% |
| Immigrants | South Eastern Asia | 99.7 /100 | #52 | Exceptional 27.1% |
| Immigrants | Jordan | 99.7 /100 | #53 | Exceptional 27.1% |
| Immigrants | Bulgaria | 99.7 /100 | #54 | Exceptional 27.1% |
| Immigrants | Egypt | 99.7 /100 | #55 | Exceptional 27.1% |
| Immigrants | Romania | 99.7 /100 | #56 | Exceptional 27.2% |
| Palestinians | 99.7 /100 | #57 | Exceptional 27.2% |
| Argentineans | 99.6 /100 | #58 | Exceptional 27.2% |
| Paraguayans | 99.6 /100 | #59 | Exceptional 27.2% |
| Eastern Europeans | 99.6 /100 | #60 | Exceptional 27.2% |
| Immigrants | Eastern Europe | 99.6 /100 | #61 | Exceptional 27.2% |
| Immigrants | Malaysia | 99.5 /100 | #62 | Exceptional 27.3% |
| Immigrants | Northern Europe | 99.5 /100 | #63 | Exceptional 27.3% |
| Russians | 99.5 /100 | #64 | Exceptional 27.3% |
Demographics Similar to Potawatomi by Single Mother Poverty
In terms of single mother poverty, the demographic groups most similar to Potawatomi are Honduran (34.2%, a difference of 0.22%), Immigrants from Mexico (34.0%, a difference of 0.42%), Alsatian (34.3%, a difference of 0.53%), Comanche (33.9%, a difference of 0.60%), and Central American Indian (34.3%, a difference of 0.61%).
| Demographics | Rating | Rank | Single Mother Poverty |
| Arapaho | 0.0 /100 | #302 | Tragic 33.4% |
| Americans | 0.0 /100 | #303 | Tragic 33.5% |
| Mexicans | 0.0 /100 | #304 | Tragic 33.6% |
| Immigrants | Central America | 0.0 /100 | #305 | Tragic 33.6% |
| Immigrants | Congo | 0.0 /100 | #306 | Tragic 33.8% |
| Comanche | 0.0 /100 | #307 | Tragic 33.9% |
| Immigrants | Mexico | 0.0 /100 | #308 | Tragic 34.0% |
| Potawatomi | 0.0 /100 | #309 | Tragic 34.1% |
| Hondurans | 0.0 /100 | #310 | Tragic 34.2% |
| Alsatians | 0.0 /100 | #311 | Tragic 34.3% |
| Central American Indians | 0.0 /100 | #312 | Tragic 34.3% |
| Immigrants | Dominican Republic | 0.0 /100 | #313 | Tragic 34.4% |
| Chickasaw | 0.0 /100 | #314 | Tragic 34.4% |
| Hopi | 0.0 /100 | #315 | Tragic 34.5% |
| Dominicans | 0.0 /100 | #316 | Tragic 34.5% |