Immigrants from Canada vs Immigrants from South Eastern Asia Male Poverty
COMPARE
Immigrants from Canada
Immigrants from South Eastern Asia
Male Poverty
Male Poverty Comparison
Immigrants from Canada
Immigrants from South Eastern Asia
10.2%
MALE POVERTY
97.1/ 100
METRIC RATING
72nd/ 347
METRIC RANK
10.6%
MALE POVERTY
88.1/ 100
METRIC RATING
117th/ 347
METRIC RANK
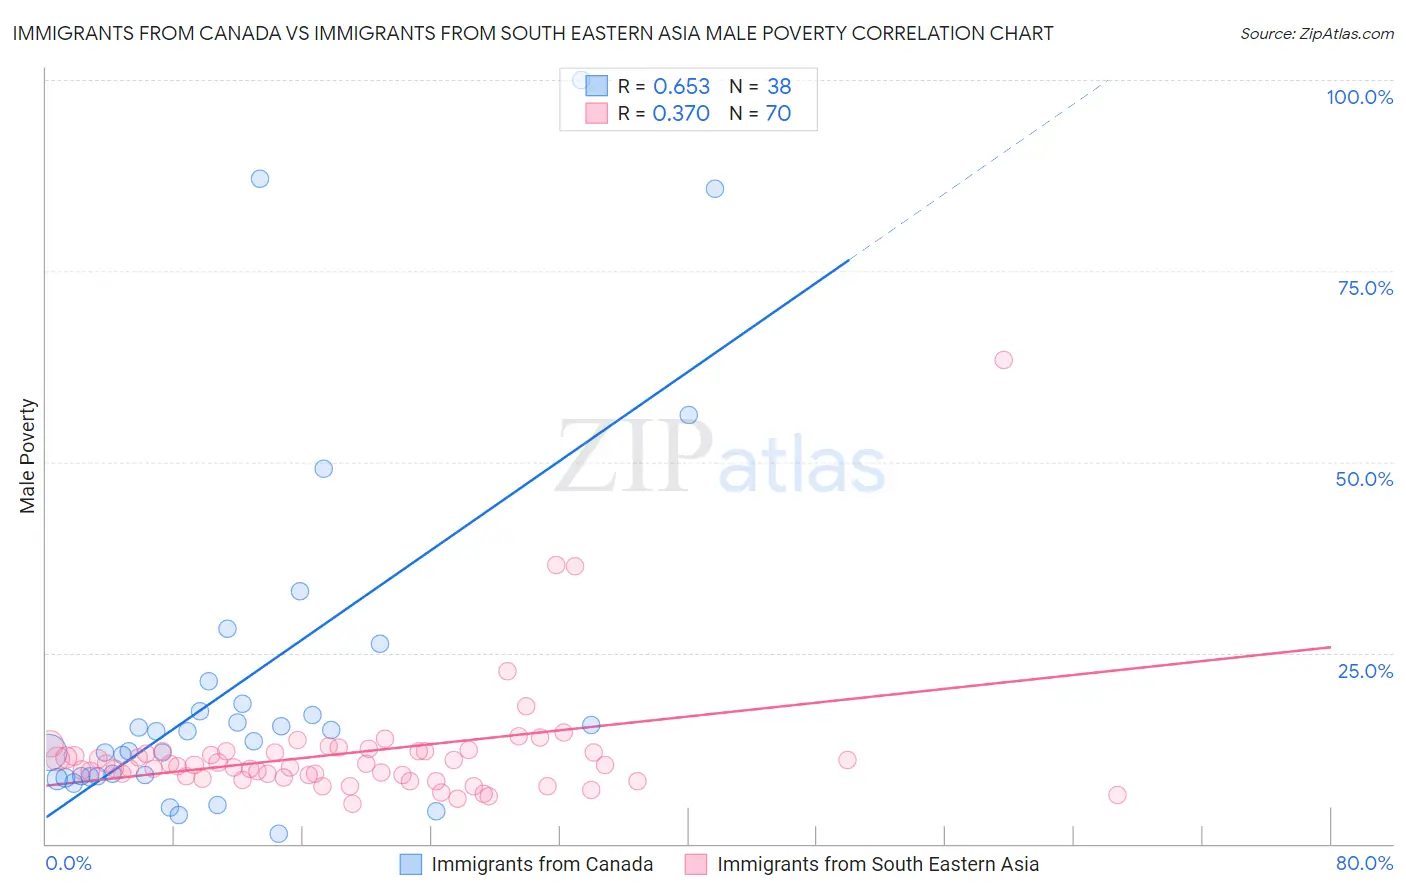
Immigrants from Canada vs Immigrants from South Eastern Asia Male Poverty Correlation Chart
The statistical analysis conducted on geographies consisting of 458,819,233 people shows a significant positive correlation between the proportion of Immigrants from Canada and poverty level among males in the United States with a correlation coefficient (R) of 0.653 and weighted average of 10.2%. Similarly, the statistical analysis conducted on geographies consisting of 511,932,643 people shows a mild positive correlation between the proportion of Immigrants from South Eastern Asia and poverty level among males in the United States with a correlation coefficient (R) of 0.370 and weighted average of 10.6%, a difference of 4.0%.
Male Poverty Correlation Summary
| Measurement | Immigrants from Canada | Immigrants from South Eastern Asia |
| Minimum | 1.3% | 5.2% |
| Maximum | 100.0% | 63.3% |
| Range | 98.8% | 58.1% |
| Mean | 21.2% | 11.9% |
| Median | 14.1% | 10.3% |
| Interquartile 25% (IQ1) | 8.8% | 8.9% |
| Interquartile 75% (IQ3) | 18.3% | 12.1% |
| Interquartile Range (IQR) | 9.5% | 3.2% |
| Standard Deviation (Sample) | 23.5% | 8.1% |
| Standard Deviation (Population) | 23.2% | 8.0% |
Similar Demographics by Male Poverty
Demographics Similar to Immigrants from Canada by Male Poverty
In terms of male poverty, the demographic groups most similar to Immigrants from Canada are European (10.2%, a difference of 0.010%), Paraguayan (10.2%, a difference of 0.030%), Immigrants from Australia (10.2%, a difference of 0.050%), Immigrants from Asia (10.2%, a difference of 0.080%), and Immigrants from Eastern Europe (10.2%, a difference of 0.16%).
| Demographics | Rating | Rank | Male Poverty |
| Zimbabweans | 97.5 /100 | #65 | Exceptional 10.2% |
| Serbians | 97.5 /100 | #66 | Exceptional 10.2% |
| Immigrants | Netherlands | 97.3 /100 | #67 | Exceptional 10.2% |
| Immigrants | Sri Lanka | 97.2 /100 | #68 | Exceptional 10.2% |
| Immigrants | Australia | 97.1 /100 | #69 | Exceptional 10.2% |
| Paraguayans | 97.1 /100 | #70 | Exceptional 10.2% |
| Europeans | 97.1 /100 | #71 | Exceptional 10.2% |
| Immigrants | Canada | 97.1 /100 | #72 | Exceptional 10.2% |
| Immigrants | Asia | 97.0 /100 | #73 | Exceptional 10.2% |
| Immigrants | Eastern Europe | 96.9 /100 | #74 | Exceptional 10.2% |
| Carpatho Rusyns | 96.9 /100 | #75 | Exceptional 10.2% |
| Dutch | 96.9 /100 | #76 | Exceptional 10.2% |
| Immigrants | Belgium | 96.8 /100 | #77 | Exceptional 10.3% |
| Irish | 96.8 /100 | #78 | Exceptional 10.3% |
| Immigrants | North America | 96.5 /100 | #79 | Exceptional 10.3% |
Demographics Similar to Immigrants from South Eastern Asia by Male Poverty
In terms of male poverty, the demographic groups most similar to Immigrants from South Eastern Asia are Sri Lankan (10.6%, a difference of 0.010%), Okinawan (10.7%, a difference of 0.11%), Immigrants from Hungary (10.7%, a difference of 0.12%), Immigrants from Russia (10.6%, a difference of 0.13%), and Immigrants from China (10.7%, a difference of 0.22%).
| Demographics | Rating | Rank | Male Poverty |
| Argentineans | 90.1 /100 | #110 | Exceptional 10.6% |
| Immigrants | Argentina | 89.8 /100 | #111 | Excellent 10.6% |
| Immigrants | Turkey | 89.5 /100 | #112 | Excellent 10.6% |
| Palestinians | 89.1 /100 | #113 | Excellent 10.6% |
| Immigrants | Brazil | 89.0 /100 | #114 | Excellent 10.6% |
| Immigrants | Russia | 88.6 /100 | #115 | Excellent 10.6% |
| Sri Lankans | 88.1 /100 | #116 | Excellent 10.6% |
| Immigrants | South Eastern Asia | 88.1 /100 | #117 | Excellent 10.6% |
| Okinawans | 87.6 /100 | #118 | Excellent 10.7% |
| Immigrants | Hungary | 87.6 /100 | #119 | Excellent 10.7% |
| Immigrants | China | 87.1 /100 | #120 | Excellent 10.7% |
| Peruvians | 87.1 /100 | #121 | Excellent 10.7% |
| Native Hawaiians | 87.0 /100 | #122 | Excellent 10.7% |
| South Africans | 86.8 /100 | #123 | Excellent 10.7% |
| French | 86.7 /100 | #124 | Excellent 10.7% |