Celtic vs Immigrants from South Eastern Asia Master's Degree
COMPARE
Celtic
Immigrants from South Eastern Asia
Master's Degree
Master's Degree Comparison
Celtics
Immigrants from South Eastern Asia
14.8%
MASTER'S DEGREE
41.3/ 100
METRIC RATING
180th/ 347
METRIC RANK
14.0%
MASTER'S DEGREE
11.9/ 100
METRIC RATING
223rd/ 347
METRIC RANK
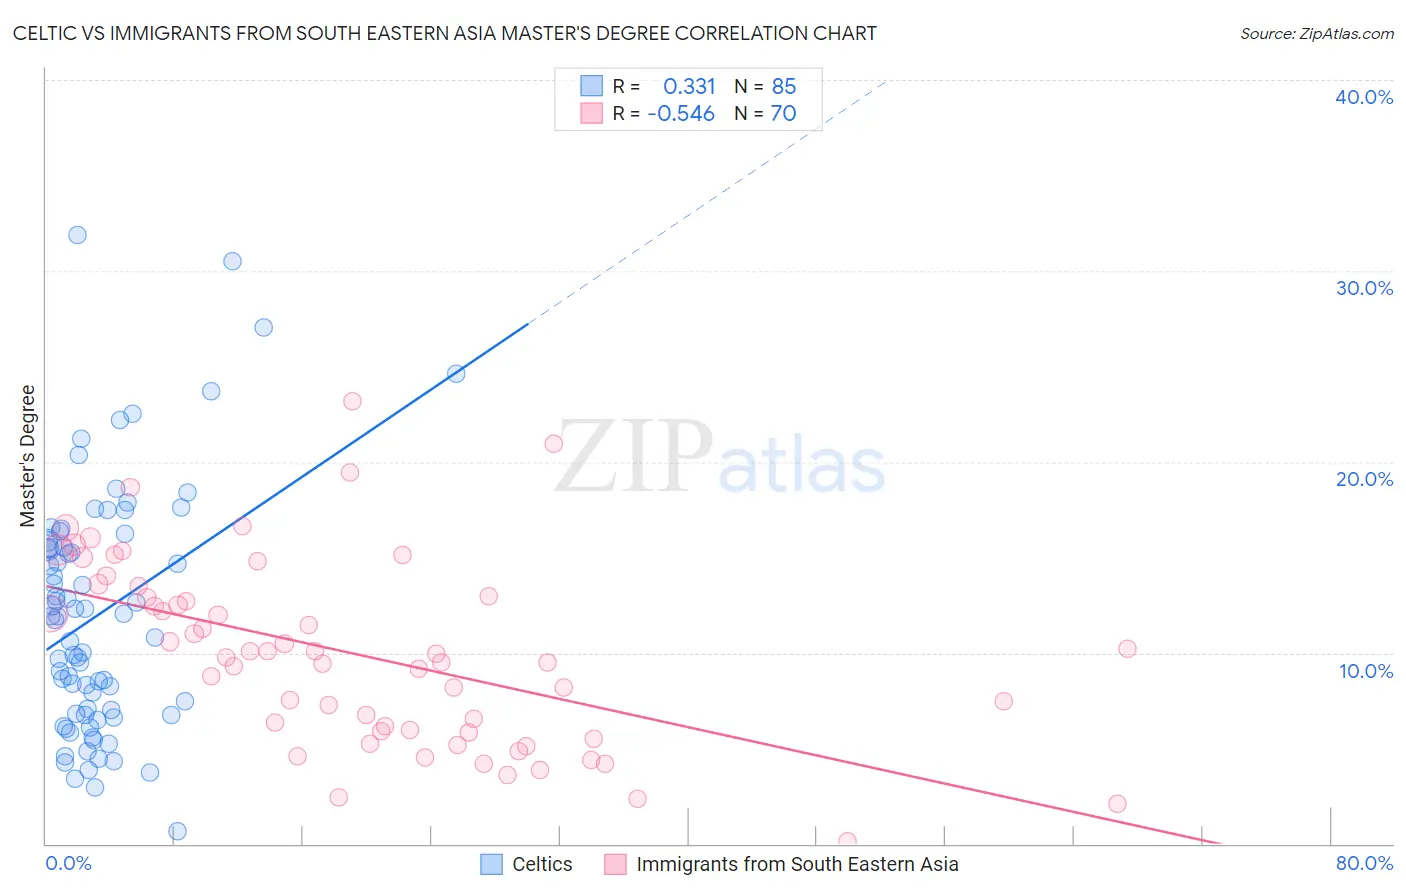
Celtic vs Immigrants from South Eastern Asia Master's Degree Correlation Chart
The statistical analysis conducted on geographies consisting of 168,868,569 people shows a mild positive correlation between the proportion of Celtics and percentage of population with at least master's degree education in the United States with a correlation coefficient (R) of 0.331 and weighted average of 14.8%. Similarly, the statistical analysis conducted on geographies consisting of 512,403,638 people shows a substantial negative correlation between the proportion of Immigrants from South Eastern Asia and percentage of population with at least master's degree education in the United States with a correlation coefficient (R) of -0.546 and weighted average of 14.0%, a difference of 5.6%.
Master's Degree Correlation Summary
| Measurement | Celtic | Immigrants from South Eastern Asia |
| Minimum | 0.67% | 0.15% |
| Maximum | 31.9% | 23.2% |
| Range | 31.2% | 23.0% |
| Mean | 12.0% | 9.9% |
| Median | 11.9% | 9.9% |
| Interquartile 25% (IQ1) | 6.8% | 5.9% |
| Interquartile 75% (IQ3) | 15.7% | 12.9% |
| Interquartile Range (IQR) | 9.0% | 7.1% |
| Standard Deviation (Sample) | 6.4% | 4.9% |
| Standard Deviation (Population) | 6.3% | 4.8% |
Similar Demographics by Master's Degree
Demographics Similar to Celtics by Master's Degree
In terms of master's degree, the demographic groups most similar to Celtics are Immigrants from Iraq (14.8%, a difference of 0.010%), Swiss (14.7%, a difference of 0.020%), Czech (14.7%, a difference of 0.12%), Sri Lankan (14.7%, a difference of 0.22%), and Immigrants from Zaire (14.7%, a difference of 0.25%).
| Demographics | Rating | Rank | Master's Degree |
| Costa Ricans | 52.5 /100 | #173 | Average 15.0% |
| Slovaks | 50.0 /100 | #174 | Average 14.9% |
| Immigrants | Peru | 49.6 /100 | #175 | Average 14.9% |
| Nigerians | 48.6 /100 | #176 | Average 14.9% |
| Immigrants | Colombia | 48.3 /100 | #177 | Average 14.9% |
| English | 45.0 /100 | #178 | Average 14.8% |
| Immigrants | Iraq | 41.3 /100 | #179 | Average 14.8% |
| Celtics | 41.3 /100 | #180 | Average 14.8% |
| Swiss | 41.1 /100 | #181 | Average 14.7% |
| Czechs | 40.4 /100 | #182 | Average 14.7% |
| Sri Lankans | 39.6 /100 | #183 | Fair 14.7% |
| Immigrants | Zaire | 39.5 /100 | #184 | Fair 14.7% |
| Barbadians | 38.3 /100 | #185 | Fair 14.7% |
| Immigrants | Oceania | 37.1 /100 | #186 | Fair 14.7% |
| Basques | 36.5 /100 | #187 | Fair 14.7% |
Demographics Similar to Immigrants from South Eastern Asia by Master's Degree
In terms of master's degree, the demographic groups most similar to Immigrants from South Eastern Asia are Immigrants from Grenada (14.0%, a difference of 0.050%), Ecuadorian (14.0%, a difference of 0.20%), Korean (14.0%, a difference of 0.23%), Portuguese (13.9%, a difference of 0.26%), and Immigrants from St. Vincent and the Grenadines (13.9%, a difference of 0.31%).
| Demographics | Rating | Rank | Master's Degree |
| Immigrants | Somalia | 15.8 /100 | #216 | Poor 14.1% |
| Immigrants | Trinidad and Tobago | 15.8 /100 | #217 | Poor 14.1% |
| French Canadians | 14.9 /100 | #218 | Poor 14.1% |
| Norwegians | 13.6 /100 | #219 | Poor 14.0% |
| Germans | 13.1 /100 | #220 | Poor 14.0% |
| Koreans | 12.7 /100 | #221 | Poor 14.0% |
| Ecuadorians | 12.6 /100 | #222 | Poor 14.0% |
| Immigrants | South Eastern Asia | 11.9 /100 | #223 | Poor 14.0% |
| Immigrants | Grenada | 11.8 /100 | #224 | Poor 14.0% |
| Portuguese | 11.2 /100 | #225 | Poor 13.9% |
| Immigrants | St. Vincent and the Grenadines | 11.0 /100 | #226 | Poor 13.9% |
| Immigrants | West Indies | 9.8 /100 | #227 | Tragic 13.9% |
| Whites/Caucasians | 9.1 /100 | #228 | Tragic 13.8% |
| British West Indians | 8.8 /100 | #229 | Tragic 13.8% |
| Dutch | 8.7 /100 | #230 | Tragic 13.8% |