Ugandan vs Immigrants from Central America Child Poverty Under the Age of 16
COMPARE
Ugandan
Immigrants from Central America
Child Poverty Under the Age of 16
Child Poverty Under the Age of 16 Comparison
Ugandans
Immigrants from Central America
17.1%
CHILD POVERTY UNDER THE AGE OF 16
14.3/ 100
METRIC RATING
202nd/ 347
METRIC RANK
21.3%
CHILD POVERTY UNDER THE AGE OF 16
0.0/ 100
METRIC RATING
307th/ 347
METRIC RANK
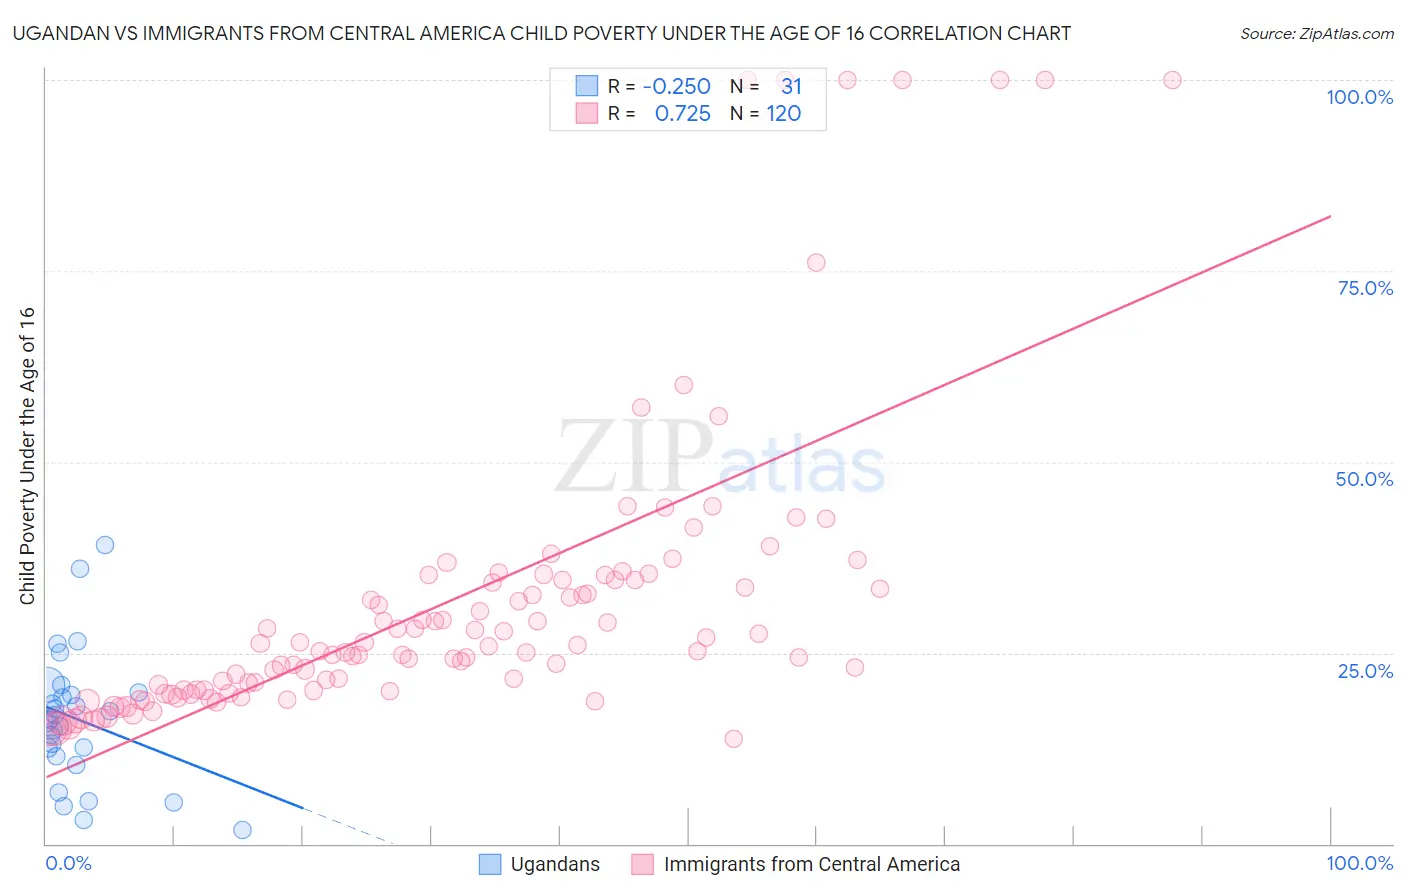
Ugandan vs Immigrants from Central America Child Poverty Under the Age of 16 Correlation Chart
The statistical analysis conducted on geographies consisting of 93,855,381 people shows a weak negative correlation between the proportion of Ugandans and poverty level among children under the age of 16 in the United States with a correlation coefficient (R) of -0.250 and weighted average of 17.1%. Similarly, the statistical analysis conducted on geographies consisting of 528,817,501 people shows a strong positive correlation between the proportion of Immigrants from Central America and poverty level among children under the age of 16 in the United States with a correlation coefficient (R) of 0.725 and weighted average of 21.3%, a difference of 24.5%.
Child Poverty Under the Age of 16 Correlation Summary
| Measurement | Ugandan | Immigrants from Central America |
| Minimum | 1.8% | 13.8% |
| Maximum | 39.2% | 100.0% |
| Range | 37.4% | 86.2% |
| Mean | 16.3% | 31.6% |
| Median | 16.3% | 25.5% |
| Interquartile 25% (IQ1) | 11.4% | 20.1% |
| Interquartile 75% (IQ3) | 19.7% | 34.5% |
| Interquartile Range (IQR) | 8.3% | 14.4% |
| Standard Deviation (Sample) | 8.6% | 19.7% |
| Standard Deviation (Population) | 8.4% | 19.6% |
Similar Demographics by Child Poverty Under the Age of 16
Demographics Similar to Ugandans by Child Poverty Under the Age of 16
In terms of child poverty under the age of 16, the demographic groups most similar to Ugandans are Immigrants from Sierra Leone (17.1%, a difference of 0.020%), Immigrants from Uzbekistan (17.1%, a difference of 0.080%), Hmong (17.1%, a difference of 0.080%), Immigrants from Cameroon (17.1%, a difference of 0.090%), and Aleut (17.1%, a difference of 0.090%).
| Demographics | Rating | Rank | Child Poverty Under the Age of 16 |
| Immigrants | Uganda | 22.5 /100 | #195 | Fair 16.8% |
| Immigrants | Lebanon | 22.0 /100 | #196 | Fair 16.8% |
| Immigrants | Kenya | 19.1 /100 | #197 | Poor 16.9% |
| Delaware | 17.1 /100 | #198 | Poor 17.0% |
| Immigrants | Afghanistan | 15.1 /100 | #199 | Poor 17.0% |
| Immigrants | Cameroon | 14.7 /100 | #200 | Poor 17.1% |
| Immigrants | Uzbekistan | 14.7 /100 | #201 | Poor 17.1% |
| Ugandans | 14.3 /100 | #202 | Poor 17.1% |
| Immigrants | Sierra Leone | 14.2 /100 | #203 | Poor 17.1% |
| Hmong | 14.0 /100 | #204 | Poor 17.1% |
| Aleuts | 13.9 /100 | #205 | Poor 17.1% |
| Alaska Natives | 11.8 /100 | #206 | Poor 17.2% |
| German Russians | 8.6 /100 | #207 | Tragic 17.4% |
| Pennsylvania Germans | 7.5 /100 | #208 | Tragic 17.4% |
| Panamanians | 6.9 /100 | #209 | Tragic 17.5% |
Demographics Similar to Immigrants from Central America by Child Poverty Under the Age of 16
In terms of child poverty under the age of 16, the demographic groups most similar to Immigrants from Central America are British West Indian (21.3%, a difference of 0.29%), Guatemalan (21.2%, a difference of 0.41%), Seminole (21.1%, a difference of 0.57%), Immigrants from Mexico (21.5%, a difference of 0.94%), and Bahamian (21.5%, a difference of 0.96%).
| Demographics | Rating | Rank | Child Poverty Under the Age of 16 |
| Indonesians | 0.0 /100 | #300 | Tragic 21.0% |
| Immigrants | Grenada | 0.0 /100 | #301 | Tragic 21.0% |
| Immigrants | Bahamas | 0.0 /100 | #302 | Tragic 21.0% |
| Choctaw | 0.0 /100 | #303 | Tragic 21.0% |
| Somalis | 0.0 /100 | #304 | Tragic 21.0% |
| Seminole | 0.0 /100 | #305 | Tragic 21.1% |
| Guatemalans | 0.0 /100 | #306 | Tragic 21.2% |
| Immigrants | Central America | 0.0 /100 | #307 | Tragic 21.3% |
| British West Indians | 0.0 /100 | #308 | Tragic 21.3% |
| Immigrants | Mexico | 0.0 /100 | #309 | Tragic 21.5% |
| Bahamians | 0.0 /100 | #310 | Tragic 21.5% |
| Dutch West Indians | 0.0 /100 | #311 | Tragic 21.5% |
| Ute | 0.0 /100 | #312 | Tragic 21.5% |
| Creek | 0.0 /100 | #313 | Tragic 21.5% |
| Immigrants | Somalia | 0.0 /100 | #314 | Tragic 21.6% |