Celtic vs Immigrants from Uzbekistan Child Poverty Under the Age of 16
COMPARE
Celtic
Immigrants from Uzbekistan
Child Poverty Under the Age of 16
Child Poverty Under the Age of 16 Comparison
Celtics
Immigrants from Uzbekistan
16.4%
CHILD POVERTY UNDER THE AGE OF 16
38.2/ 100
METRIC RATING
183rd/ 347
METRIC RANK
17.1%
CHILD POVERTY UNDER THE AGE OF 16
14.7/ 100
METRIC RATING
201st/ 347
METRIC RANK
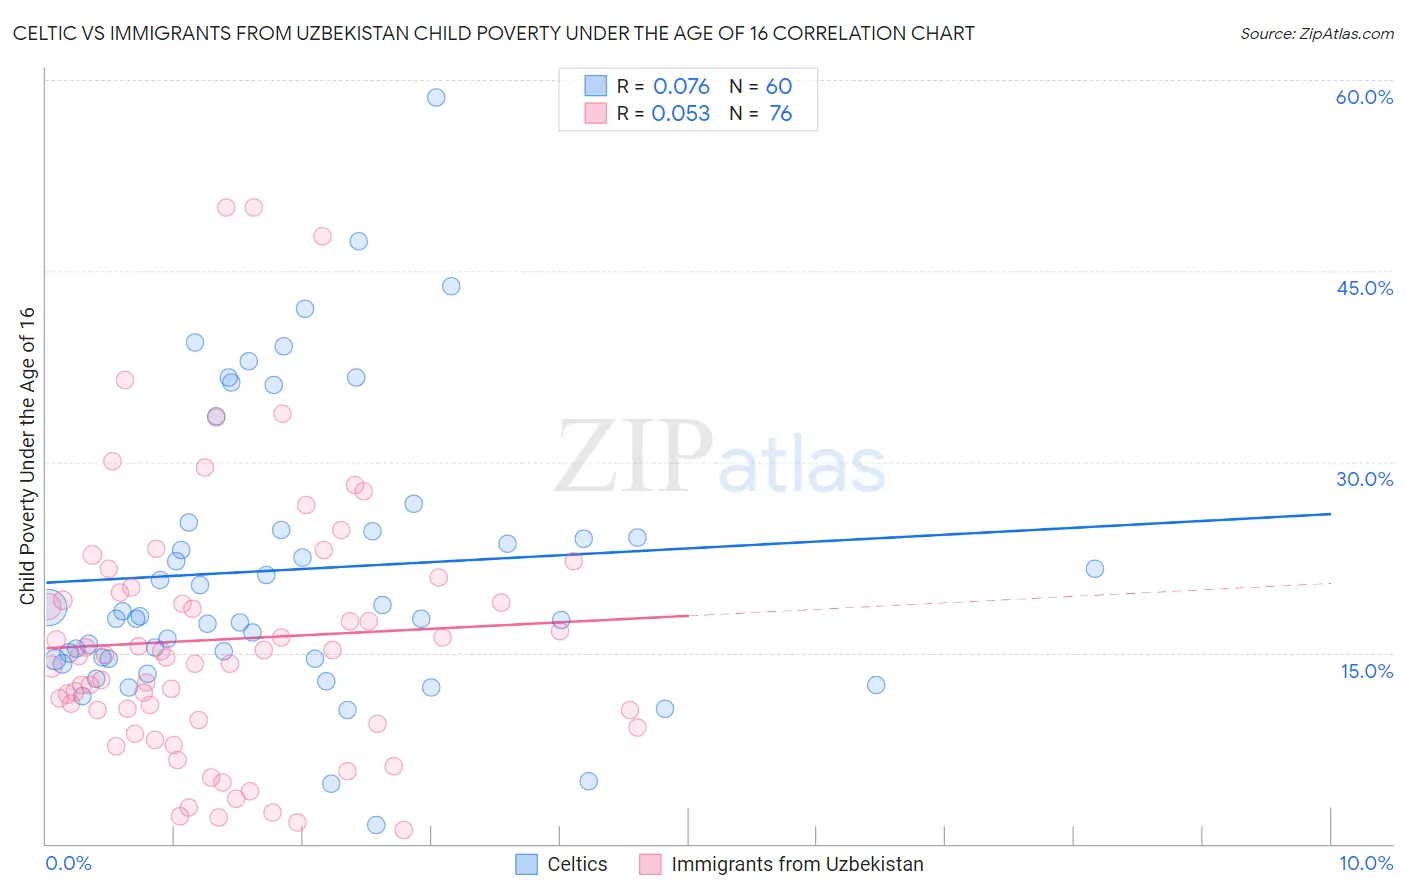
Celtic vs Immigrants from Uzbekistan Child Poverty Under the Age of 16 Correlation Chart
The statistical analysis conducted on geographies consisting of 168,036,388 people shows a slight positive correlation between the proportion of Celtics and poverty level among children under the age of 16 in the United States with a correlation coefficient (R) of 0.076 and weighted average of 16.4%. Similarly, the statistical analysis conducted on geographies consisting of 118,316,672 people shows a slight positive correlation between the proportion of Immigrants from Uzbekistan and poverty level among children under the age of 16 in the United States with a correlation coefficient (R) of 0.053 and weighted average of 17.1%, a difference of 3.8%.
Child Poverty Under the Age of 16 Correlation Summary
| Measurement | Celtic | Immigrants from Uzbekistan |
| Minimum | 1.4% | 1.1% |
| Maximum | 58.6% | 50.0% |
| Range | 57.2% | 48.9% |
| Mean | 21.5% | 16.1% |
| Median | 17.8% | 14.7% |
| Interquartile 25% (IQ1) | 14.5% | 9.6% |
| Interquartile 75% (IQ3) | 24.6% | 19.9% |
| Interquartile Range (IQR) | 10.1% | 10.3% |
| Standard Deviation (Sample) | 11.2% | 10.5% |
| Standard Deviation (Population) | 11.1% | 10.4% |
Demographics Similar to Celtics and Immigrants from Uzbekistan by Child Poverty Under the Age of 16
In terms of child poverty under the age of 16, the demographic groups most similar to Celtics are Hawaiian (16.4%, a difference of 0.010%), Immigrants from Western Asia (16.4%, a difference of 0.020%), Immigrants from Bosnia and Herzegovina (16.5%, a difference of 0.10%), Kenyan (16.5%, a difference of 0.52%), and Arab (16.6%, a difference of 0.88%). Similarly, the demographic groups most similar to Immigrants from Uzbekistan are Immigrants from Cameroon (17.1%, a difference of 0.010%), Ugandan (17.1%, a difference of 0.080%), Immigrants from Afghanistan (17.0%, a difference of 0.11%), Delaware (17.0%, a difference of 0.52%), and Immigrants from Kenya (16.9%, a difference of 0.91%).
| Demographics | Rating | Rank | Child Poverty Under the Age of 16 |
| Hawaiians | 38.2 /100 | #182 | Fair 16.4% |
| Celtics | 38.2 /100 | #183 | Fair 16.4% |
| Immigrants | Western Asia | 38.0 /100 | #184 | Fair 16.4% |
| Immigrants | Bosnia and Herzegovina | 37.4 /100 | #185 | Fair 16.5% |
| Kenyans | 34.1 /100 | #186 | Fair 16.5% |
| Arabs | 31.4 /100 | #187 | Fair 16.6% |
| Immigrants | Morocco | 31.2 /100 | #188 | Fair 16.6% |
| Immigrants | Portugal | 30.0 /100 | #189 | Fair 16.6% |
| Immigrants | Costa Rica | 29.6 /100 | #190 | Fair 16.6% |
| Immigrants | Iraq | 28.3 /100 | #191 | Fair 16.7% |
| Spanish | 24.5 /100 | #192 | Fair 16.7% |
| Spaniards | 23.2 /100 | #193 | Fair 16.8% |
| Immigrants | Uruguay | 23.1 /100 | #194 | Fair 16.8% |
| Immigrants | Uganda | 22.5 /100 | #195 | Fair 16.8% |
| Immigrants | Lebanon | 22.0 /100 | #196 | Fair 16.8% |
| Immigrants | Kenya | 19.1 /100 | #197 | Poor 16.9% |
| Delaware | 17.1 /100 | #198 | Poor 17.0% |
| Immigrants | Afghanistan | 15.1 /100 | #199 | Poor 17.0% |
| Immigrants | Cameroon | 14.7 /100 | #200 | Poor 17.1% |
| Immigrants | Uzbekistan | 14.7 /100 | #201 | Poor 17.1% |
| Ugandans | 14.3 /100 | #202 | Poor 17.1% |