Immigrants from Philippines vs Houma Poverty
COMPARE
Immigrants from Philippines
Houma
Poverty
Poverty Comparison
Immigrants from Philippines
Houma
11.0%
POVERTY
98.7/ 100
METRIC RATING
52nd/ 347
METRIC RANK
18.4%
POVERTY
0.0/ 100
METRIC RATING
333rd/ 347
METRIC RANK
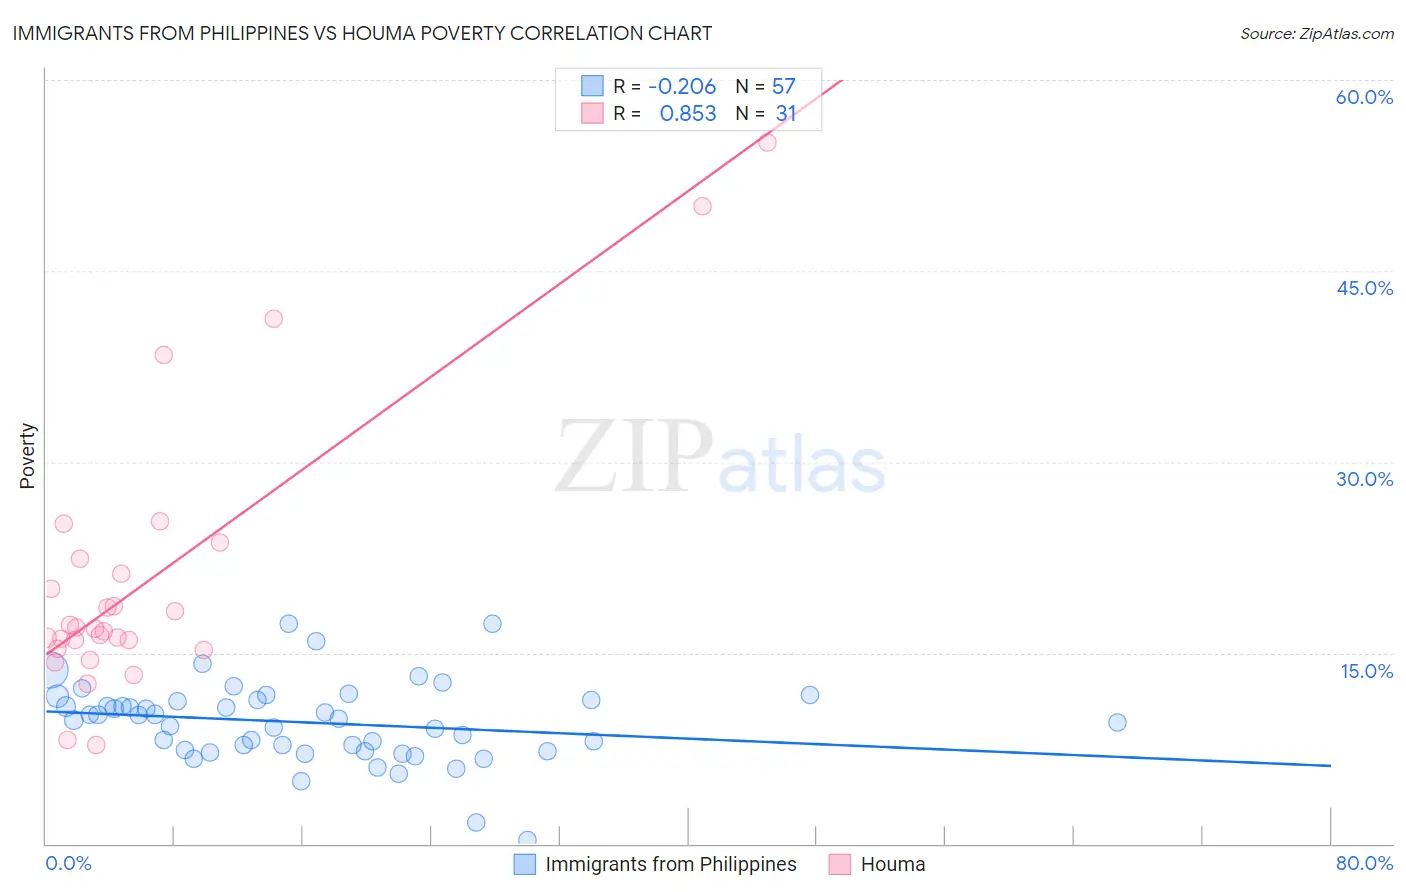
Immigrants from Philippines vs Houma Poverty Correlation Chart
The statistical analysis conducted on geographies consisting of 471,023,634 people shows a weak negative correlation between the proportion of Immigrants from Philippines and poverty level in the United States with a correlation coefficient (R) of -0.206 and weighted average of 11.0%. Similarly, the statistical analysis conducted on geographies consisting of 36,796,778 people shows a very strong positive correlation between the proportion of Houma and poverty level in the United States with a correlation coefficient (R) of 0.853 and weighted average of 18.4%, a difference of 67.0%.
Poverty Correlation Summary
| Measurement | Immigrants from Philippines | Houma |
| Minimum | 0.27% | 7.7% |
| Maximum | 17.3% | 55.1% |
| Range | 17.0% | 47.4% |
| Mean | 9.5% | 20.8% |
| Median | 9.9% | 16.9% |
| Interquartile 25% (IQ1) | 7.3% | 15.3% |
| Interquartile 75% (IQ3) | 11.3% | 22.4% |
| Interquartile Range (IQR) | 4.0% | 7.1% |
| Standard Deviation (Sample) | 3.2% | 11.0% |
| Standard Deviation (Population) | 3.1% | 10.8% |
Similar Demographics by Poverty
Demographics Similar to Immigrants from Philippines by Poverty
In terms of poverty, the demographic groups most similar to Immigrants from Philippines are Immigrants from Croatia (11.0%, a difference of 0.020%), Immigrants from Austria (11.1%, a difference of 0.23%), Immigrants from Bulgaria (11.1%, a difference of 0.34%), Immigrants from Serbia (11.1%, a difference of 0.37%), and Asian (11.0%, a difference of 0.42%).
| Demographics | Rating | Rank | Poverty |
| Turks | 98.9 /100 | #45 | Exceptional 11.0% |
| Immigrants | Czechoslovakia | 98.9 /100 | #46 | Exceptional 11.0% |
| Immigrants | Romania | 98.9 /100 | #47 | Exceptional 11.0% |
| Slovenes | 98.9 /100 | #48 | Exceptional 11.0% |
| Immigrants | Japan | 98.9 /100 | #49 | Exceptional 11.0% |
| Asians | 98.9 /100 | #50 | Exceptional 11.0% |
| Immigrants | Croatia | 98.7 /100 | #51 | Exceptional 11.0% |
| Immigrants | Philippines | 98.7 /100 | #52 | Exceptional 11.0% |
| Immigrants | Austria | 98.6 /100 | #53 | Exceptional 11.1% |
| Immigrants | Bulgaria | 98.5 /100 | #54 | Exceptional 11.1% |
| Immigrants | Serbia | 98.5 /100 | #55 | Exceptional 11.1% |
| Estonians | 98.2 /100 | #56 | Exceptional 11.1% |
| Scandinavians | 98.2 /100 | #57 | Exceptional 11.1% |
| Germans | 98.1 /100 | #58 | Exceptional 11.1% |
| Immigrants | Europe | 98.0 /100 | #59 | Exceptional 11.2% |
Demographics Similar to Houma by Poverty
In terms of poverty, the demographic groups most similar to Houma are Apache (18.4%, a difference of 0.0%), Native/Alaskan (18.1%, a difference of 2.0%), Cheyenne (18.9%, a difference of 2.8%), Immigrants from Dominican Republic (17.8%, a difference of 3.5%), and Dominican (17.6%, a difference of 4.4%).
| Demographics | Rating | Rank | Poverty |
| Paiute | 0.0 /100 | #326 | Tragic 16.7% |
| Kiowa | 0.0 /100 | #327 | Tragic 16.8% |
| Ute | 0.0 /100 | #328 | Tragic 16.9% |
| Blacks/African Americans | 0.0 /100 | #329 | Tragic 17.3% |
| Dominicans | 0.0 /100 | #330 | Tragic 17.6% |
| Immigrants | Dominican Republic | 0.0 /100 | #331 | Tragic 17.8% |
| Natives/Alaskans | 0.0 /100 | #332 | Tragic 18.1% |
| Houma | 0.0 /100 | #333 | Tragic 18.4% |
| Apache | 0.0 /100 | #334 | Tragic 18.4% |
| Cheyenne | 0.0 /100 | #335 | Tragic 18.9% |
| Pueblo | 0.0 /100 | #336 | Tragic 19.4% |
| Sioux | 0.0 /100 | #337 | Tragic 19.8% |
| Yuman | 0.0 /100 | #338 | Tragic 20.2% |
| Crow | 0.0 /100 | #339 | Tragic 20.7% |
| Yup'ik | 0.0 /100 | #340 | Tragic 20.8% |