Carpatho Rusyn vs Immigrants from South America Disability Age 18 to 34
COMPARE
Carpatho Rusyn
Immigrants from South America
Disability Age 18 to 34
Disability Age 18 to 34 Comparison
Carpatho Rusyns
Immigrants from South America
6.9%
DISABILITY AGE 18 TO 34
5.2/ 100
METRIC RATING
223rd/ 347
METRIC RANK
5.8%
DISABILITY AGE 18 TO 34
99.9/ 100
METRIC RATING
38th/ 347
METRIC RANK
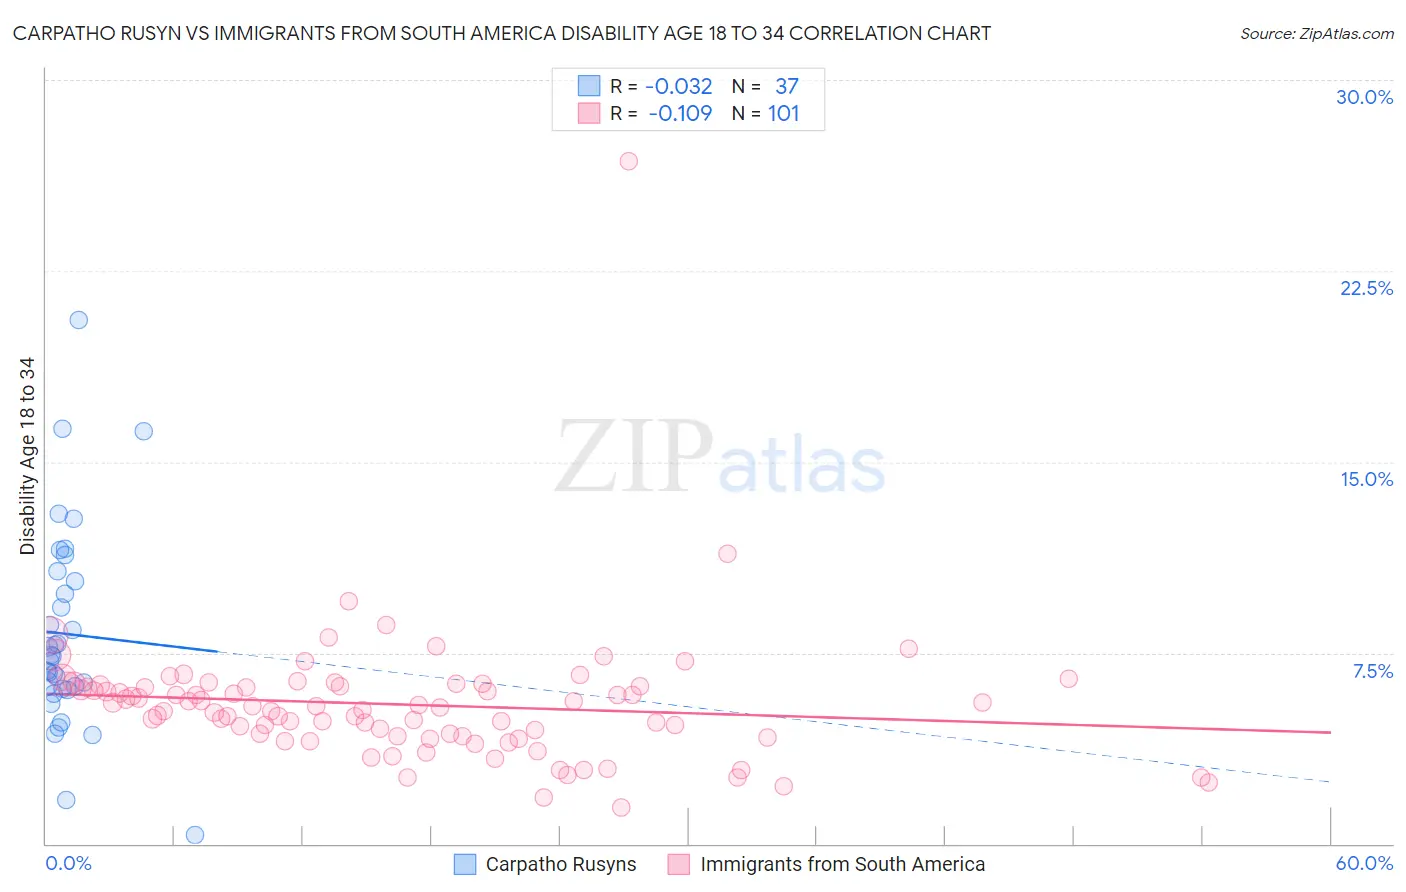
Carpatho Rusyn vs Immigrants from South America Disability Age 18 to 34 Correlation Chart
The statistical analysis conducted on geographies consisting of 58,823,868 people shows no correlation between the proportion of Carpatho Rusyns and percentage of population with a disability between the ages 18 and 35 in the United States with a correlation coefficient (R) of -0.032 and weighted average of 6.9%. Similarly, the statistical analysis conducted on geographies consisting of 484,466,989 people shows a poor negative correlation between the proportion of Immigrants from South America and percentage of population with a disability between the ages 18 and 35 in the United States with a correlation coefficient (R) of -0.109 and weighted average of 5.8%, a difference of 19.3%.
Disability Age 18 to 34 Correlation Summary
| Measurement | Carpatho Rusyn | Immigrants from South America |
| Minimum | 0.36% | 1.4% |
| Maximum | 20.6% | 26.8% |
| Range | 20.2% | 25.4% |
| Mean | 8.2% | 5.5% |
| Median | 7.4% | 5.4% |
| Interquartile 25% (IQ1) | 6.0% | 4.2% |
| Interquartile 75% (IQ3) | 10.5% | 6.2% |
| Interquartile Range (IQR) | 4.5% | 2.0% |
| Standard Deviation (Sample) | 4.0% | 2.7% |
| Standard Deviation (Population) | 4.0% | 2.7% |
Similar Demographics by Disability Age 18 to 34
Demographics Similar to Carpatho Rusyns by Disability Age 18 to 34
In terms of disability age 18 to 34, the demographic groups most similar to Carpatho Rusyns are Immigrants from England (6.9%, a difference of 0.030%), Senegalese (6.9%, a difference of 0.090%), Immigrants from Middle Africa (6.9%, a difference of 0.10%), Immigrants from Senegal (6.9%, a difference of 0.11%), and Central American Indian (6.9%, a difference of 0.17%).
| Demographics | Rating | Rank | Disability Age 18 to 34 |
| Sudanese | 7.0 /100 | #216 | Tragic 6.9% |
| Immigrants | Kenya | 6.9 /100 | #217 | Tragic 6.9% |
| Ukrainians | 6.7 /100 | #218 | Tragic 6.9% |
| Hawaiians | 6.5 /100 | #219 | Tragic 6.9% |
| Immigrants | Senegal | 5.5 /100 | #220 | Tragic 6.9% |
| Immigrants | Middle Africa | 5.5 /100 | #221 | Tragic 6.9% |
| Immigrants | England | 5.3 /100 | #222 | Tragic 6.9% |
| Carpatho Rusyns | 5.2 /100 | #223 | Tragic 6.9% |
| Senegalese | 4.9 /100 | #224 | Tragic 6.9% |
| Central American Indians | 4.7 /100 | #225 | Tragic 6.9% |
| Ugandans | 4.4 /100 | #226 | Tragic 6.9% |
| Immigrants | Canada | 4.3 /100 | #227 | Tragic 7.0% |
| Immigrants | Yemen | 4.2 /100 | #228 | Tragic 7.0% |
| Lithuanians | 4.1 /100 | #229 | Tragic 7.0% |
| Immigrants | North America | 3.9 /100 | #230 | Tragic 7.0% |
Demographics Similar to Immigrants from South America by Disability Age 18 to 34
In terms of disability age 18 to 34, the demographic groups most similar to Immigrants from South America are Armenian (5.8%, a difference of 0.020%), Ecuadorian (5.8%, a difference of 0.11%), Immigrants from Lithuania (5.8%, a difference of 0.27%), Asian (5.8%, a difference of 0.30%), and Bolivian (5.8%, a difference of 0.38%).
| Demographics | Rating | Rank | Disability Age 18 to 34 |
| Iranians | 99.9 /100 | #31 | Exceptional 5.8% |
| Immigrants | Barbados | 99.9 /100 | #32 | Exceptional 5.8% |
| Argentineans | 99.9 /100 | #33 | Exceptional 5.8% |
| Venezuelans | 99.9 /100 | #34 | Exceptional 5.8% |
| Immigrants | Lithuania | 99.9 /100 | #35 | Exceptional 5.8% |
| Ecuadorians | 99.9 /100 | #36 | Exceptional 5.8% |
| Armenians | 99.9 /100 | #37 | Exceptional 5.8% |
| Immigrants | South America | 99.9 /100 | #38 | Exceptional 5.8% |
| Asians | 99.9 /100 | #39 | Exceptional 5.8% |
| Bolivians | 99.9 /100 | #40 | Exceptional 5.8% |
| Nicaraguans | 99.9 /100 | #41 | Exceptional 5.8% |
| Colombians | 99.8 /100 | #42 | Exceptional 5.9% |
| South Americans | 99.8 /100 | #43 | Exceptional 5.9% |
| Immigrants | Asia | 99.8 /100 | #44 | Exceptional 5.9% |
| Immigrants | Peru | 99.8 /100 | #45 | Exceptional 5.9% |