Carpatho Rusyn vs Immigrants from the Azores 8th Grade
COMPARE
Carpatho Rusyn
Immigrants from the Azores
8th Grade
8th Grade Comparison
Carpatho Rusyns
Immigrants from the Azores
98.1%
8TH GRADE
100.0/ 100
METRIC RATING
4th/ 347
METRIC RANK
92.5%
8TH GRADE
0.0/ 100
METRIC RATING
327th/ 347
METRIC RANK
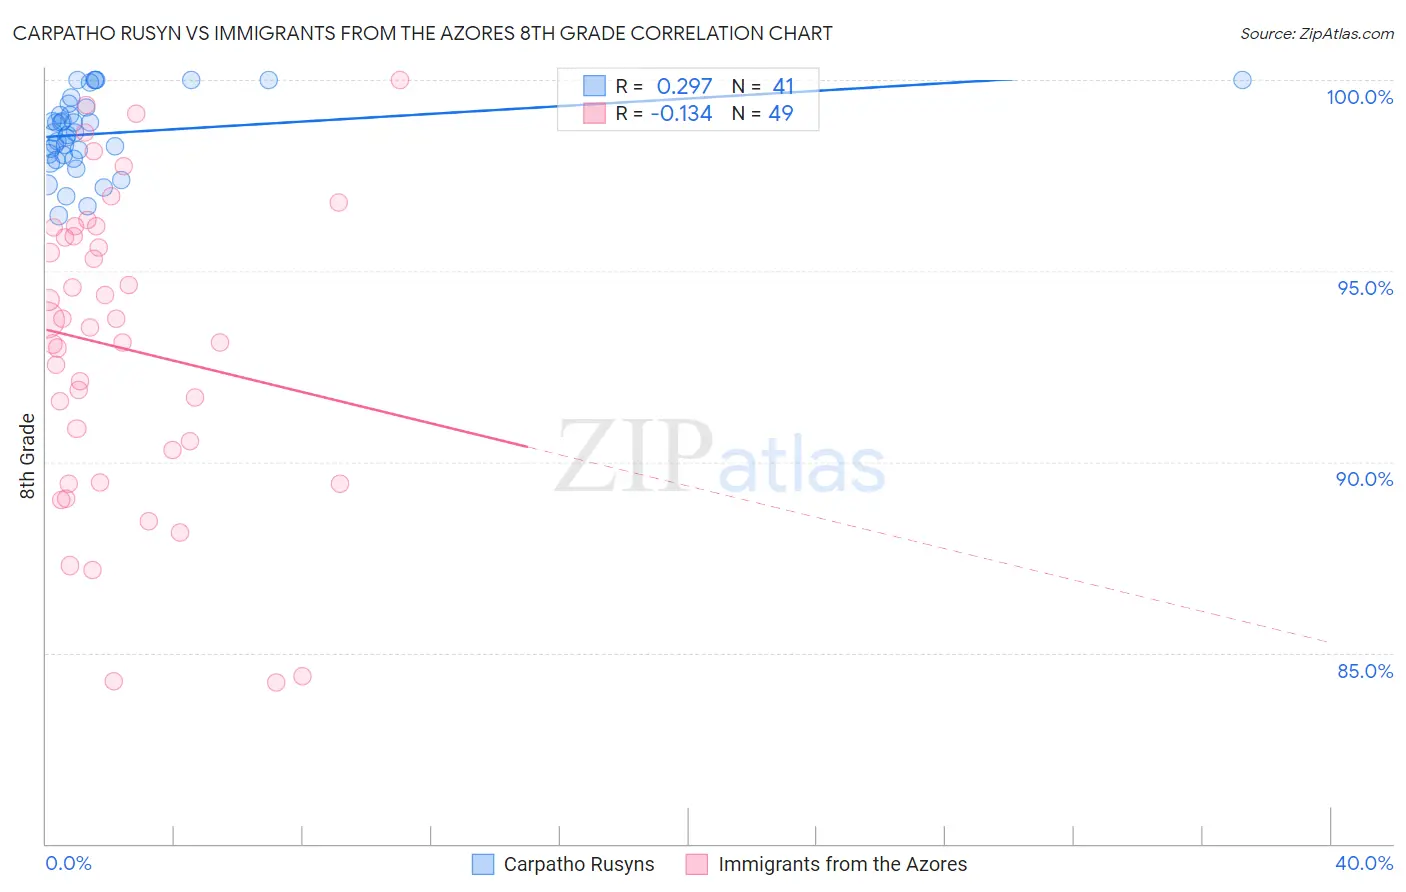
Carpatho Rusyn vs Immigrants from the Azores 8th Grade Correlation Chart
The statistical analysis conducted on geographies consisting of 10,071,463 people shows a weak positive correlation between the proportion of Carpatho Rusyns and percentage of population with at least 8th grade education in the United States with a correlation coefficient (R) of 0.297 and weighted average of 98.1%. Similarly, the statistical analysis conducted on geographies consisting of 46,257,310 people shows a poor negative correlation between the proportion of Immigrants from the Azores and percentage of population with at least 8th grade education in the United States with a correlation coefficient (R) of -0.134 and weighted average of 92.5%, a difference of 6.1%.
8th Grade Correlation Summary
| Measurement | Carpatho Rusyn | Immigrants from the Azores |
| Minimum | 96.4% | 84.2% |
| Maximum | 100.0% | 100.0% |
| Range | 3.6% | 15.8% |
| Mean | 98.6% | 93.0% |
| Median | 98.6% | 93.5% |
| Interquartile 25% (IQ1) | 98.0% | 89.9% |
| Interquartile 75% (IQ3) | 99.3% | 96.0% |
| Interquartile Range (IQR) | 1.4% | 6.2% |
| Standard Deviation (Sample) | 0.98% | 4.0% |
| Standard Deviation (Population) | 0.97% | 3.9% |
Similar Demographics by 8th Grade
Demographics Similar to Carpatho Rusyns by 8th Grade
In terms of 8th grade, the demographic groups most similar to Carpatho Rusyns are Ottawa (97.9%, a difference of 0.20%), Finnish (98.4%, a difference of 0.23%), Dutch (97.7%, a difference of 0.49%), Norwegian (97.6%, a difference of 0.55%), and Slovak (97.6%, a difference of 0.59%).
| Demographics | Rating | Rank | 8th Grade |
| Crow | 100.0 /100 | #1 | Exceptional 99.0% |
| Tsimshian | 100.0 /100 | #2 | Exceptional 99.0% |
| Finns | 100.0 /100 | #3 | Exceptional 98.4% |
| Carpatho Rusyns | 100.0 /100 | #4 | Exceptional 98.1% |
| Ottawa | 100.0 /100 | #5 | Exceptional 97.9% |
| Dutch | 100.0 /100 | #6 | Exceptional 97.7% |
| Norwegians | 100.0 /100 | #7 | Exceptional 97.6% |
| Slovaks | 100.0 /100 | #8 | Exceptional 97.6% |
| Germans | 100.0 /100 | #9 | Exceptional 97.5% |
| Slovenes | 100.0 /100 | #10 | Exceptional 97.5% |
| Poles | 100.0 /100 | #11 | Exceptional 97.4% |
| Swedes | 100.0 /100 | #12 | Exceptional 97.4% |
| Alaskan Athabascans | 100.0 /100 | #13 | Exceptional 97.3% |
| English | 100.0 /100 | #14 | Exceptional 97.3% |
| Pennsylvania Germans | 100.0 /100 | #15 | Exceptional 97.3% |
Demographics Similar to Immigrants from the Azores by 8th Grade
In terms of 8th grade, the demographic groups most similar to Immigrants from the Azores are Immigrants from Nicaragua (92.5%, a difference of 0.030%), Immigrants from Cabo Verde (92.4%, a difference of 0.090%), Immigrants from Armenia (92.3%, a difference of 0.18%), Honduran (92.3%, a difference of 0.19%), and Immigrants from Dominican Republic (92.3%, a difference of 0.20%).
| Demographics | Rating | Rank | 8th Grade |
| Immigrants | Fiji | 0.0 /100 | #320 | Tragic 93.2% |
| Belizeans | 0.0 /100 | #321 | Tragic 93.1% |
| Nicaraguans | 0.0 /100 | #322 | Tragic 93.0% |
| Immigrants | Belize | 0.0 /100 | #323 | Tragic 92.9% |
| Nepalese | 0.0 /100 | #324 | Tragic 92.8% |
| Dominicans | 0.0 /100 | #325 | Tragic 92.8% |
| Central American Indians | 0.0 /100 | #326 | Tragic 92.7% |
| Immigrants | Azores | 0.0 /100 | #327 | Tragic 92.5% |
| Immigrants | Nicaragua | 0.0 /100 | #328 | Tragic 92.5% |
| Immigrants | Cabo Verde | 0.0 /100 | #329 | Tragic 92.4% |
| Immigrants | Armenia | 0.0 /100 | #330 | Tragic 92.3% |
| Hondurans | 0.0 /100 | #331 | Tragic 92.3% |
| Immigrants | Dominican Republic | 0.0 /100 | #332 | Tragic 92.3% |
| Hispanics or Latinos | 0.0 /100 | #333 | Tragic 92.2% |
| Immigrants | Yemen | 0.0 /100 | #334 | Tragic 92.1% |